Systematic Review / Open Access
DOI: 10.31488/bjcr.214
Artificial Intelligence for Nodule Detection in Thoracic Computed Tomography: A Systematic review and Structural Analysis Based on the MI-CLAIM Model
Frederik Duedahl* 1, Sabine Morris Delhez2, Benjamin Schnack Brandt Rasmussen3, Michael Stenger4
1. Department of Cardiothoracic and Vascular Surgery, Odense University Hospital & Department of Clinical Research, Odense University Hospital, Denmark
2. Department of Radioglogy, Odense University Hospital, Denmark
3. Department of Cardiothoracic and Vascular Surgery, Odense University Hospital, Denmark
*Corresponding author:Frederik Duedahl, MD, Department of Cardiothoracic and Vascular Surgery, Odense University Hospital & Department of Clinical Research, Odense University Hospital, Denmark, Tel: +45 66113333; E-mail: frederik.duedahl@rsyd.dk.
Abstract
Background: Lung cancer remains a leading cause of cancer-related mortality, predominantly due to late-stage diagnosis. Lowdose Computed Tomography (LDCT) screening can reduce mortality but implementation is often challenged by already limited radiology resources. Artificial intelligence (AI) has the potential to improve CT-based lung nodule detection, but systematic and unified reporting on data sources, development, and model performance remains limited. This review applies MI-CLAIM and QUADAS-2 to assess methodological quality and reporting, following PRISMA-P guidelines1. Objectives: 1) Identify AI applications for thoracic CT nodule detection and their diagnostic accuracy. 2) Evaluate clinical implications, validation setup and data foundation. 3) Assess adherence to the MI-CLAIM checklist. Methods: Databases (Medline, IEEE Xplore, Web of Science, Embase, Cinahl, Scopus, Cochrane, Google Scholar) were systematically searched using an adapted search string for the respective databases, developed with a trained librarian. Two named reviewers1,2 independently screened, and a third³ resolved disagreements. Data extraction focused on PICO elements, diagnostic performance, and reporting and bias with MI-CLAIM and QUADAS-2 adherence. The search concluded on the 27th of December 2024 Results Of 11,875 records identified, 8,729 remained after removal of duplicates. After title and abstract screening, 93 full-text articles were assessed, and 23 met the inclusion criteria. Most included studies were published after 2019 and were based on retrospective hospital CT datasets. According to QUADAS-2, 11 studies had low risk of bias. Mean MI-CLAIM adherence was 65%, and 3 of 23 studies achieved high reporting completeness. Reported AI sensitivities ranged from 59.2% to 98.8%, and false-positive rates from 0.067 to 2.4 per scan. Validation was mainly retrospective, with only 3 studies using prospective data. Conclusion: AI for thoracic CT nodule detection shows promising but heterogeneous diagnostic performance, mostly based on retrospective, single-centre data with incomplete reporting. Before routine clinical use, robust external validation studies with prospective design and transparent reporting are required.
Key wordsartificial intelligence, lung cancer, computed tomography, systematic review
Introduction
Lung cancer is recognized as the most deadly malignancy worldwide [1], primarily due to the advanced stage at diagnosis, where options of curative treatment are limited [2]. The delay in detection and diagnosis significantly contributes to lung cancer's high mortality rate and underscores the need for early detection strategies [3].
Although Low-Dose Computed Tomography (LDCT) screening can reduce the lung cancer specific mortality significantly by earlier detection, it introduces a significant increase in workload for radiologists [4,5]. Integrating Artificial Intelligence (AI), has been proposed and in recent years proven to streamline this process, reduce diagnostic variability, and maintain high accuracy [6-8].
However, different international guidelines (e.g., “Fleischner-Society”, “Chinese Medical Association guideline for clinical diagnosis and treatment of lung cancer” etc.) impose various criteria on nodule thresholds, features and follow-up protocols, creating inconsistencies in the development and design of AI algorithms as well as training datasets with global applications in mind.
The model framework and technical foundation of a lung nodule detection algorithm, including how key performance metrics are defined and evaluated, are critical for clinical integration. However, existing primary studies and systematic reviews show that methodologies are highly heterogeneous and often sparsely reported, with variable metrics, limited description of patient populations and reference standards, and generally low certainty of evidence, which reduces reproducibility and clinical trust [9,10]. This PRISMA-based systematic review aims to characterise current applications of artificial intelligence for lung nodule and lung cancer detection in thoracic CT. It aims to summarise their diagnostic accuracy, evaluate the validation design, data foundation, and methodological transparency of these studies.
Methods
Protocol and registration
Protocol registered with PROSPERO (CRD42024428566): https://www.crd.york.ac.uk/PROSPERO/ view/CRD42024428566.
Eligibility criteria using PICO-Guidelines
Population: Individuals receiving thoracic CT scans for lung nodule evaluation or lung cancer screening purposes. Studies involving clinical settings (as opposed to purely phantom or animal models).
Intervention: AI methods (machine learning, deep learning, neural networks, radiomics) used to detect lung nodules or primary lung cancer on thoracic CT scans
Comparison: Comparing AI-assisted diagnostics with traditional diagnostic methods or no intervention, if applicable.
Outcomes: Adherence to guidelines and reporting methods (MI-CLAIM [11] , and a modified QUADAS-2 [12]). Detection sensitivity, specificity, accuracy, positive predictive value, negative predictive value. Clinical implications (e.g., workflow impact, reporting consistency).
Study designs: Randomized controlled trials (RCTs), cohort studies, cross-sectional, retrospective or prospective observational studies, diagnostic accuracy studies. Original research only (no editorials, case reports, purely technical algorithm-development papers without clinical data, etc.).
Inclusion Criteria: Studies published between 2010 and 2025 in English (or translations available in English). Peer-reviewed, full-text articles. Human subjects. Sufficient reporting of diagnostic performance or diagnostic performance and efficacy, accuracy, or clinical implications to lung nodule/lung cancer detection.
Exclusion criteria: Non-original research (editorials, conference abstracts without available data, commentaries, pictorial essays). Studies focused purely on algorithmic or image optimization. Reviews, systematic reviews, meta-analyses (these may be used as background references, but not included as primary data). Studies on metastatic disease from non-lung primaries. Pure classification or segmentation studies. Non-thoracic imaging.
Information sources
The following online databases were identified based on suspected relevance and impact of publications: Embase/PubMed, IEEE Xplore, Web of Science, CINAHL, Google Scholar, Cochrane Library and Scopus. Additionally, we searched the following additional sources for information: “Gray literature” and conference proceedings.
Search strategy
A general search string was created and later adapted to each of the listed databases (specific examples in Appendix A). Search terms and Boolean operators were used when applicable. The general search string was created in collaboration with a trained librarian at our institute. The search concluded on the 27th of December 2024.
Selection process
The two independent reviewers (FD¹ and SMD²) initially screened titles and abstracts in COVIDENCE according to predefined eligibility criteria, applying the COVIDENCE machine learning tool and the inclusion / exclusion highlighting filters. Potentially relevant articles underwent full-text assessment by the same two reviewers. Any disagreements were resolved by consensus meetings or by consulting a third Radiology Specialist-reviewer (BSR³)
Data items / extraction process
After performing the study selection process all eligible studies were subjected to data extraction. A subset of the extracted data points are outlined in Tables 1 and 2. Both reviewers independently completed the extraction to maintain accuracy and consistency. For this process, COVIDENCE’s embedded extraction tool was used. Discrepancies in the screening and data extraction phases were resolved through discussion or, if necessary, with input from the Radiolgy special reviewer. For the full list of extracted variables, see Appendix D
Quality assessment / risk of bias
Each included study underwent a two-part quality assessment. We applied QUADAS-2 to assess risk of bias and applicability in diagnostic accuracy outcomes. We kept the four standard QUADAS-2 domains but tailored the signalling questions to our review question and the AI setting. Each study was categorized as either overall "low" or "high" risk based on the number of domains (patient selection, index test, reference standard, flow and timing) assessed as low risk ("+"). A study was considered low risk overall if it scored "+" in three or more of the four domains.
We then used the MI-CLAIM framework to assess methodology, reporting transparency, and AI-specific aspects. We chose MI-CLAIM rather than CLAIM because of its focus on core clinical AI modelling steps rather than imaging workflow alone. Both assessments were performed after full-text review. QUADAS-2 ratings were recorded in Covidence, and MI-CLAIM ratings in two independent spreadsheets. Disagreements were resolved as in the data extraction process.
Effect measures
The main effect measures were study-level sensitivity and specificity, including 95% confidence intervals when reported. Where available, we also extracted accuracy, area under the curve, false positives per scan, predictive values, and reading time. Outcomes were treated as binary or continuous as appropriate and summarised descriptively; no formal meta-analysis was performed.
Data synthesis
Data were exported from COVIDENCE and processed in Microsoft Excel (Version 16.95.25031528, 2025 – Microsoft Corporation, Washington, USA) and StataBE (StataNow 18.5, StataCorp, College Station, TX, USA). A PRISMA flow diagram was used to show study selection, and simple forest plots were used to display study-level sensitivity where data allowed (Figure1). We grouped studies by clinical application (screening vs. non-screening), type of AI implementation (commercial vs. in-house), and type of reported accuracy metrics. Not all studies reported the same outcomes; for each outcome we used all available studies without imputing missing data. Results were presented in structured summary tables for QUADAS-2 ratings, MI-CLAIM completion and study characteristics, (Table 1, 2 and 3).
Table 1. Risk of bias assessment by category for AI for lung cancer detection studies performed with the modified QUADAS-2.(+= green, low risk of bias for, ?=orange, unclear risk of bias, −= yellow, high risk of bias)
| Risk of bias w. modified QUADAS-2 | Reference | Year & First Author | Patient Selection | Index Test | Reference Standard | Flow & Timing |
|---|---|---|---|---|---|---|
| Low Risk | 13 | 2023 Hendrix | + | + | + | + |
| 14 | 2022 Yacoub | + | + | + | + | |
| 15 | 2023 Aboelenin | ? | + | + | + | |
| 16 | 2019 Liu | ? | + | + | + | |
| 17 | 2005 Armato | - | + | + | + | |
| 18 | 2012 Bogoni | + | + | - | + | |
| 19 | 2023 Chao | - | + | + | + | |
| 20 | 2023 Chen | - | + | + | + | |
| 21 | 2022 Cui | - | + | + | + | |
| 22 | 2022 Murchison | - | + | + | + | |
| 23 | 2020 Xu | + | + | - | + | |
| High Risk | 24 | 2023 Pan | - | ? | + | + |
| 25 | 2019 Zhang | - | ? | + | + | |
| 26 | 2020 Kozuka | - | + | + | - | |
| 27 | 2019 Li | - | + | + | - | |
| 28 | 2021 Jarnalo | + | - | - | + | |
| 29 | 2022 Zhang | + | - | - | + | |
| 30 | 2022 Abadia | - | + | - | ? | |
| 31 | 2022 Chen | - | ? | + | - | |
| 32 | 2022 Du | - | ? | + | - | |
| 33 | 2022 Hu | - | - | ? | + | |
| 34 | 2022 Lan | - | - | - | ? | |
| 35 | 2008 Hirose | - | - | - | - |
Table 2. Reporting Quality of the Included Studies Based on the MI-CLAIM Checklist. *=Overall percentage of maximal score available by max 5 points in Study Design, 4 in Data and Optimization, 3 in Model Performance, 5 in Model Examination, and 1 point in Reproducibility.
| Year And First Author | Reference | Study Design | Data & Optimization | Model Performance | Model Examination | Reproducibility | Overall % |
|---|---|---|---|---|---|---|---|
| 2022 Murchison | 22 | 5 | 4 | 3 | 4 | 1 | 80.60 |
| 2022 Abadia | 30 | 5 | 4 | 3 | 3 | 1 | 77.80 |
| 2023 Hendrix | 13 | 5 | 3 | 3 | 4 | 1 | 77.80 |
| 2023 Chen | 20 | 5 | 3 | 3 | 3 | 1 | 75.00 |
| 2023 Chao | 19 | 4 | 4 | 3 | 4 | 1 | 72.20 |
| 2022 Zhang | 29 | 5 | 3 | 3 | 3 | 1 | 72.20 |
| 2022 Cui | 21 | 4 | 4 | 3 | 3 | 1 | 69.40 |
| 2020 Xu | 23 | 4 | 4 | 3 | 3 | 1 | 69.40 |
| 2022 Yacoub | 14 | 4 | 3 | 3 | 3 | 1 | 66.70 |
| 2005 Armato | 17 | 4 | 3 | 3 | 3 | 1 | 66.70 |
| 2012 Bogoni | 18 | 4 | 4 | 2 | 3 | 1 | 66.70 |
| 2021 Jarnalo | 28 | 5 | 2 | 3 | 3 | 1 | 66.70 |
| 2022 Du | 32 | 4 | 3 | 3 | 3 | 1 | 66.70 |
| 2022 Lan | 34 | 5 | 3 | 2 | 2 | 1 | 66.70 |
| 2023 Aboelenin | 15 | 4 | 3 | 3 | 3 | 1 | 63.90 |
| 2019 Liu | 16 | 4 | 3 | 3 | 3 | 1 | 63.90 |
| 2019 Zhang | 25 | 5 | 3 | 2 | 2 | 1 | 63.90 |
| 2022 Hu | 33 | 4 | 3 | 2 | 2 | 1 | 61.10 |
| 2008 Hirose | 35 | 4 | 3 | 3 | 2 | 1 | 61.10 |
| 2020 Kozuka | 26 | 4 | 3 | 3 | 2 | 1 | 58.30 |
| 2019 Li | 27 | 4 | 2 | 2 | 3 | 1 | 58.30 |
| 2022 Chen | 1 | 3 | 3 | 3 | 2 | 1 | 58.30 |
| 2023 Pan | 24 | 4 | 0 | 0 | 0 | 0 | 22.20 |
Table 3. Primary characteristics, methods and outcomes from the included (n=23) studies, listed in accordance with the modified QUADAS-2 assessment. (CNN=Convolutional Neural Network, DL=Deep Learning; CAD=Computer Automated Detection, ML=Machine Learning; FPN= Feature Pyramid Network; NN=Neural Network; R-CNN=Region-based Convolutional Neural Networks)(*=450.000 CT images, not further specified.
| Year & Author | Reference | Sponsorship | Study Type | CT Scans | Reference Standard | Labeling Method | Validation/Test Size | Network Type | Model Name | Sensitivity (%) | Sensitivity Range | PPV (%) |
|---|---|---|---|---|---|---|---|---|---|---|---|---|
| 2023 Hendrix | 13 | Retrospective | 2878 | Radiologist Consensus | Semi-automatic Annotations | 200 | ResNet50, YOLOv5 | Open Source | 92.40 | |||
| 2022 Yacoub | 14 | Retrospective | Radiologist Consensus | 100 | CNN | AI-Rad Companion (Siemens Healthineers) | 92.80 | 84.9–97.3 | 96.3 | |||
| 2023 Aboelenin | 15 | Self-funded | Retrospective | Radiologist Consensus | 79 | DL, CAD | AVIEW Metric (Coreline Soft) | 93.00 | 98.1 | |||
| 2019 Liu | 16 | Governmental | Retrospective | 11625 | Radiologist Consensus | Bounding Box | 1129 | DenseNet, R-CNN | InferRead CT Lung | 80.50 | 75.0–86.0 | |
| 2005 Armato | 17 | Governmental | Retrospective | 197 | Biopsy, Radiologist | Bounding Box | 393 | CAD | 70.00 | |||
| 2012 Bogoni | 18 | Governmental | Retrospective | 330 | Radiologist Consensus | Automated Segmentation | 747 | ML | Syngo CAD Manager 2008B | 66.00 | ||
| 2023 Chao | 19 | V5 Technologies | Retrospective | Radiologist Consensus | ROI | 200 | CNN | V5-MED-LU01 | 95.60 | |||
| 2023 Chen | 20 | Corporate and Governmental | Retrospective | 1231 | Radiologist Consensus | Coordinates | 394 | FPN, NN | Institutional + Commercial collaboration | 90.19 | 89.39–90.96 | |
| 2022 Cui | 21 | Governmental | Prospective | Radiologist Consensus | Coordinates | 360 | DL, CNN | International institutional collaboration | 90.10 | 86.4–93.7 | ||
| 2022 Murchison | 22 | Governmental and Aidence | Retrospective | 45000* | Radiologist Consensus | 337 | DL-CAD | Veye Chest v2.0 | 95.50 | 82.3–89.0 | ||
| 2020 Xu | 23 | Governmental | Retrospective | 887 | Radiologist, AI | Bounding Box | 111 | CNN, V-Net | Institutional Collaboration | 93.09 | ||
| 2023 Pan | 24 | Retrospective | Pathology, Radiologist | Automated Segmentation | 309 | DL, ML | 84.90 | |||||
| 2019 Zhang | 25 | Governmental | Prospective | 3042 | Pathology, Radiologists | Bounding Box | 807 | CNN, DL | 96.00 | |||
| 2020 Kozuka | 26 | Retrospective | Radiologist Consensus | Bounding Box | 117 | DenseNet, R-CNN | InferRead CT Lung | 95.50 | 57.9 | |||
| 2019 Li | 27 | Retrospective | Radiologist Consensus | 346 | DL, CNN | σ-Discover Lung | 86.20 | 84.1–88.8 | 57.0 | |||
| 2021 Jarnalo | 28 | Retrospective | Radiologist Consensus | 145 | DL-CAD | Veye Chest | 88.00 | |||||
| 2022 Zhang | 29 | Governmental | Retrospective | 11625 | Radiologist Consensus | Bounding Box | 874 | DenseNet, R-CNN | InferRead CT Lung | 99.30 | 98.8–100 | |
| 2022 Abadia | 30 | Siemens Healthineers | Retrospective | Radiologist | 143 | CNN | AI-Rad Companion | 96.10 | 87.7 | |||
| 2022 Chen | 31 | Retrospective | Pathology | 104 | CNN | Deepwise Healthcare v1.3.0 | 94.12 | 85.11 | ||||
| 2022 Du | 32 | Retrospective | Pathology | 152 | 92.98 | 95.21 | ||||||
| 2022 Hu | 33 | Prospective | 450000* | Radiologist Consensus, CAD | 117 | DenseNet, R-CNN | InferRead CT Lung | 58.63 | 44.27–66.86 | |||
| 2022 Lan | 34 | Retrospective | 1018 | Radiologist, AI | Pseudo-labeling | 60 | CNN, FC | ResNet18 | 69.80 | |||
| 2008 Hirose | 35 | Retrospective | 3 | Radiologist, CAD | Automated Segmentation | 141 | 2D CAD | ZIOCAD LE v1.15 | 71.40 |
The reporting order of studies followed the overall risk-of-bias judgement from the modified QUADAS-2 tool. We did not perform formal statistical heterogeneity analyses or sensitivity analyses because no meta-analytical pooling of effect measures was undertaken and due to the descriptive synthesis and substantial heterogeneity in populations, AI models, and outcome definitions. Potential selective reporting is described qualitatively in the Results and Discussion.
Results
Search results and study selection
A total of 11,875 studies were initially identified. After removal of 3,146 duplicates, 8,729 studies remained for title and abstract screening. Of these, 93 studies were selected for full-text evaluation, and following eligibility assessment, 23 studies [13- 35] were included in the final analysis. 70 were excluded due to: wrong setting (n=5), outcomes (n=4), comparator (n=2), intervention (n=4), study design (n=6), unavailable full text (n=17), no translation (n=3), wrong patient population (n=6), or main focus on algorithm coding/development (n=23). The identification, screening, exclusions and inclusions of studies is presented in the PRISMA flow chart, see Figure 1.
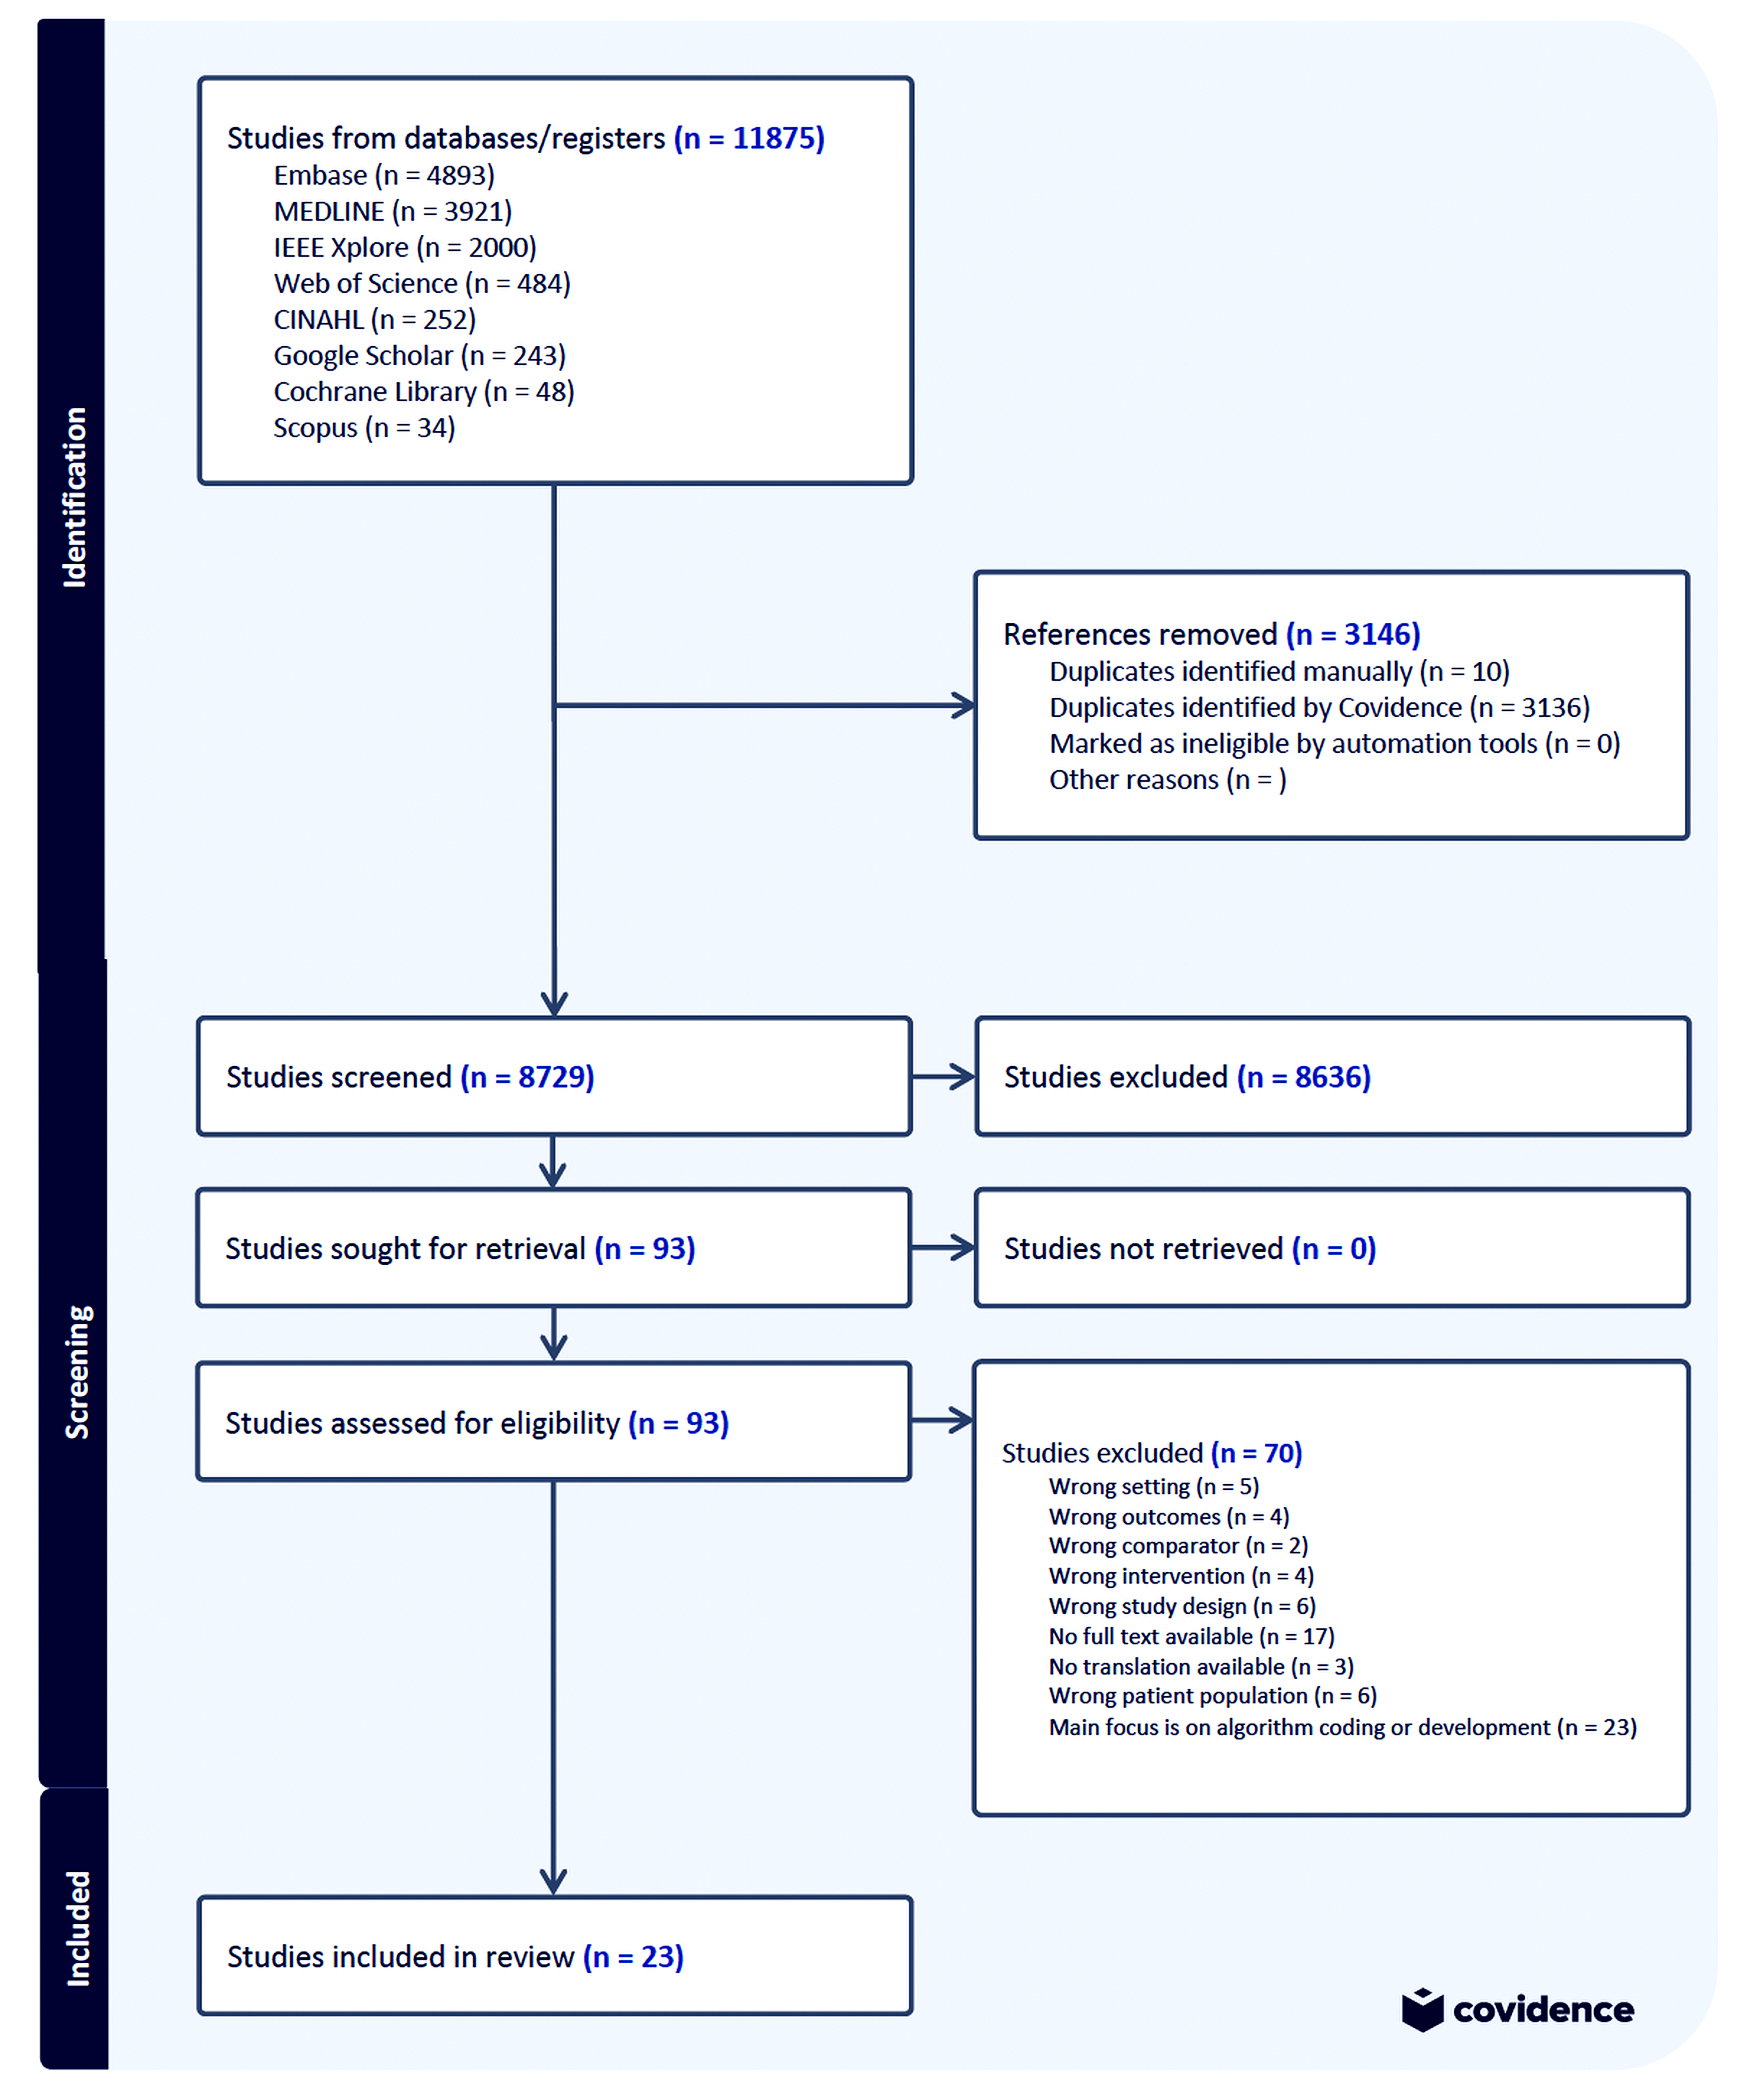
Figure 1:PRISMA flowchart for the systematic review of AI for lung cancer detection.
Study characteristics of included studies
Fourteen of the twentythree included studies were published after 2022 and a total of 20 studies after 2019. Twenty studies used retrospective hospital-based datasets, averaging around 7000 CT scans for training sets, except for one study that reported the total number of CT-images instead [33]. Defining sizes of training dataset were inconsistent, thus complicating standardized comparisons. Some reported as individual pictures [25] and some as number of CT scans [17].
The typical reference standard used was consensus annotations between radiologists [14,16]. Two studies relied only on the pathology reports as definition of the reference standard [31,32]. Of the reported labeling methods, “Bounding Box”- and “X-, Y- and Z-coordinate” methods were the most prevalent types of annotation. The average size of the included datasets for external and internal testing, where 320 cases (both CT and tumors). The most commonly used commercialized application was “InferRead CT Lung” applied in four studies. Primary characteristics for the included studies are listed in Table 3.
QUADAS-2
As shown in Table 1, 11 studies were classified as overall low risk, and 12 were classified as overall high risk. Generally, the domain of “Patient Selection” demonstrated the greatest concern, with only 6 studies rated as low risk, 15 rated as high risk, and 2 studies having unclear risk. In contrast, domains such as index test, reference standard, and flow and timing were predominantly rated as low risk, with 14, 15, and 16 studies scoring low risk of bias, respectively. Specifically, among the overall low-risk studies, "patient selection" remained an issue, with some studies [15,16] rated as unclear ("?") and others explicitly as high risk ("-"), indicating variability within the overall low risk subgroup as well. Among high-risk studies, recurring issues included missing or limited descriptions of the reference standard or unclear reporting of the index test.
MI-CLAIM assessment
The included studies had a mean MI-CLAIM completion rate of approximately 65%. Studies classified as having a low risk of bias, according to the QUADAS-2 assessment (Table 1), [13,23] had an overall higher rate of reported items compared to studies classified as high risk (24–35) in the MI-CLAIM Checklist. Specifically, 27% of overall low-risk studies achieved a high MICLAIM completion (≥75%) compared to 8% of overall high-risk studies, but this difference was not statistically significant (chisquared = 0.42; p = 0.52).
Two studies, Aboelenin et al. and Hendrix et al., provided sufficiently detailed information to enable reproducibility; of these, only Hendrix et al. also met the ≥75% overall MI-CLAIM completion threshold. Most other studies did not facilitate reproducibility due to inadequate reporting. All 23 studies were retained in the descriptive synthesis and summary tables, but diagnostic accuracy estimates from studies with lower risk of bias and higher MI-CLAIM completion were given greater weight when interpreting ranges and formulating conclusions.
Four studies demonstrated high overall completion of MICLAIM checklist items (≥75%), [13,19,22,30]. Sections related to model performance, model examination, and reproducibility showed lower reporting rates across the remaining studies.
Overall, adherence to MI-CLAIM guidelines was inconsistent, and none of the included studies adhered fully to the reporting standards listed in the MI-CLAIM, see Table 2.
Reported outcome metrics
Outcome metrics were reported heterogeneously across the included studies as presented in Table 3. Sensitivity and specificity were the most frequently reported metrics. Sensitivities ranged from 59.2% to 98.8%, and specificities from 61.8% to 100% [14,15,21,25,26,29,34]. Even among low–risk-of-bias, moderate-to-high–quality studies, reported sensitivities varied widely. Crude sensitivity pooling weighted by validation/test sample size, found pooled sensitivity was 82.1% among low risk-of-bias studies and 91.4% among high or unclear risk-of-bias studies, corresponding to an overall pooled sensitivity of 86.3%.
False-positive outcomes were explicitly reported in 20 of the 23 studies. Where expressed per scan, false-positive rates ranged from 0.07 to 2.4 FP/scan in both low- and high-risk-ofbias studies. In comparative designs, AI-assisted reading usually maintained or reduced the false-positive burden compared with unaided radiologists while increasing sensitivity. Stand-alone AI systems showed more variable, and at times higher, false-positive rates than the human reference standard [34].
Performance metrics such as Positive Predictive Value (PPV), Negative Predictive Value (NPV), and F1-score were inconsistently reported. With AI-assistance, the PPV ranged between 57.9% to 70.5%
AI-assistance typically lead to slight reductions attributed to increased sensitivity and a higher rate of initial detections requiring subsequent validation as described in a single study [26].
Sensitivity for each study is displayed in the Forest Plot (Figure 2), with accompanying range, if available. The range of AI sensitivity is achieved by several training-rounds, and seven of the included studies reported this data
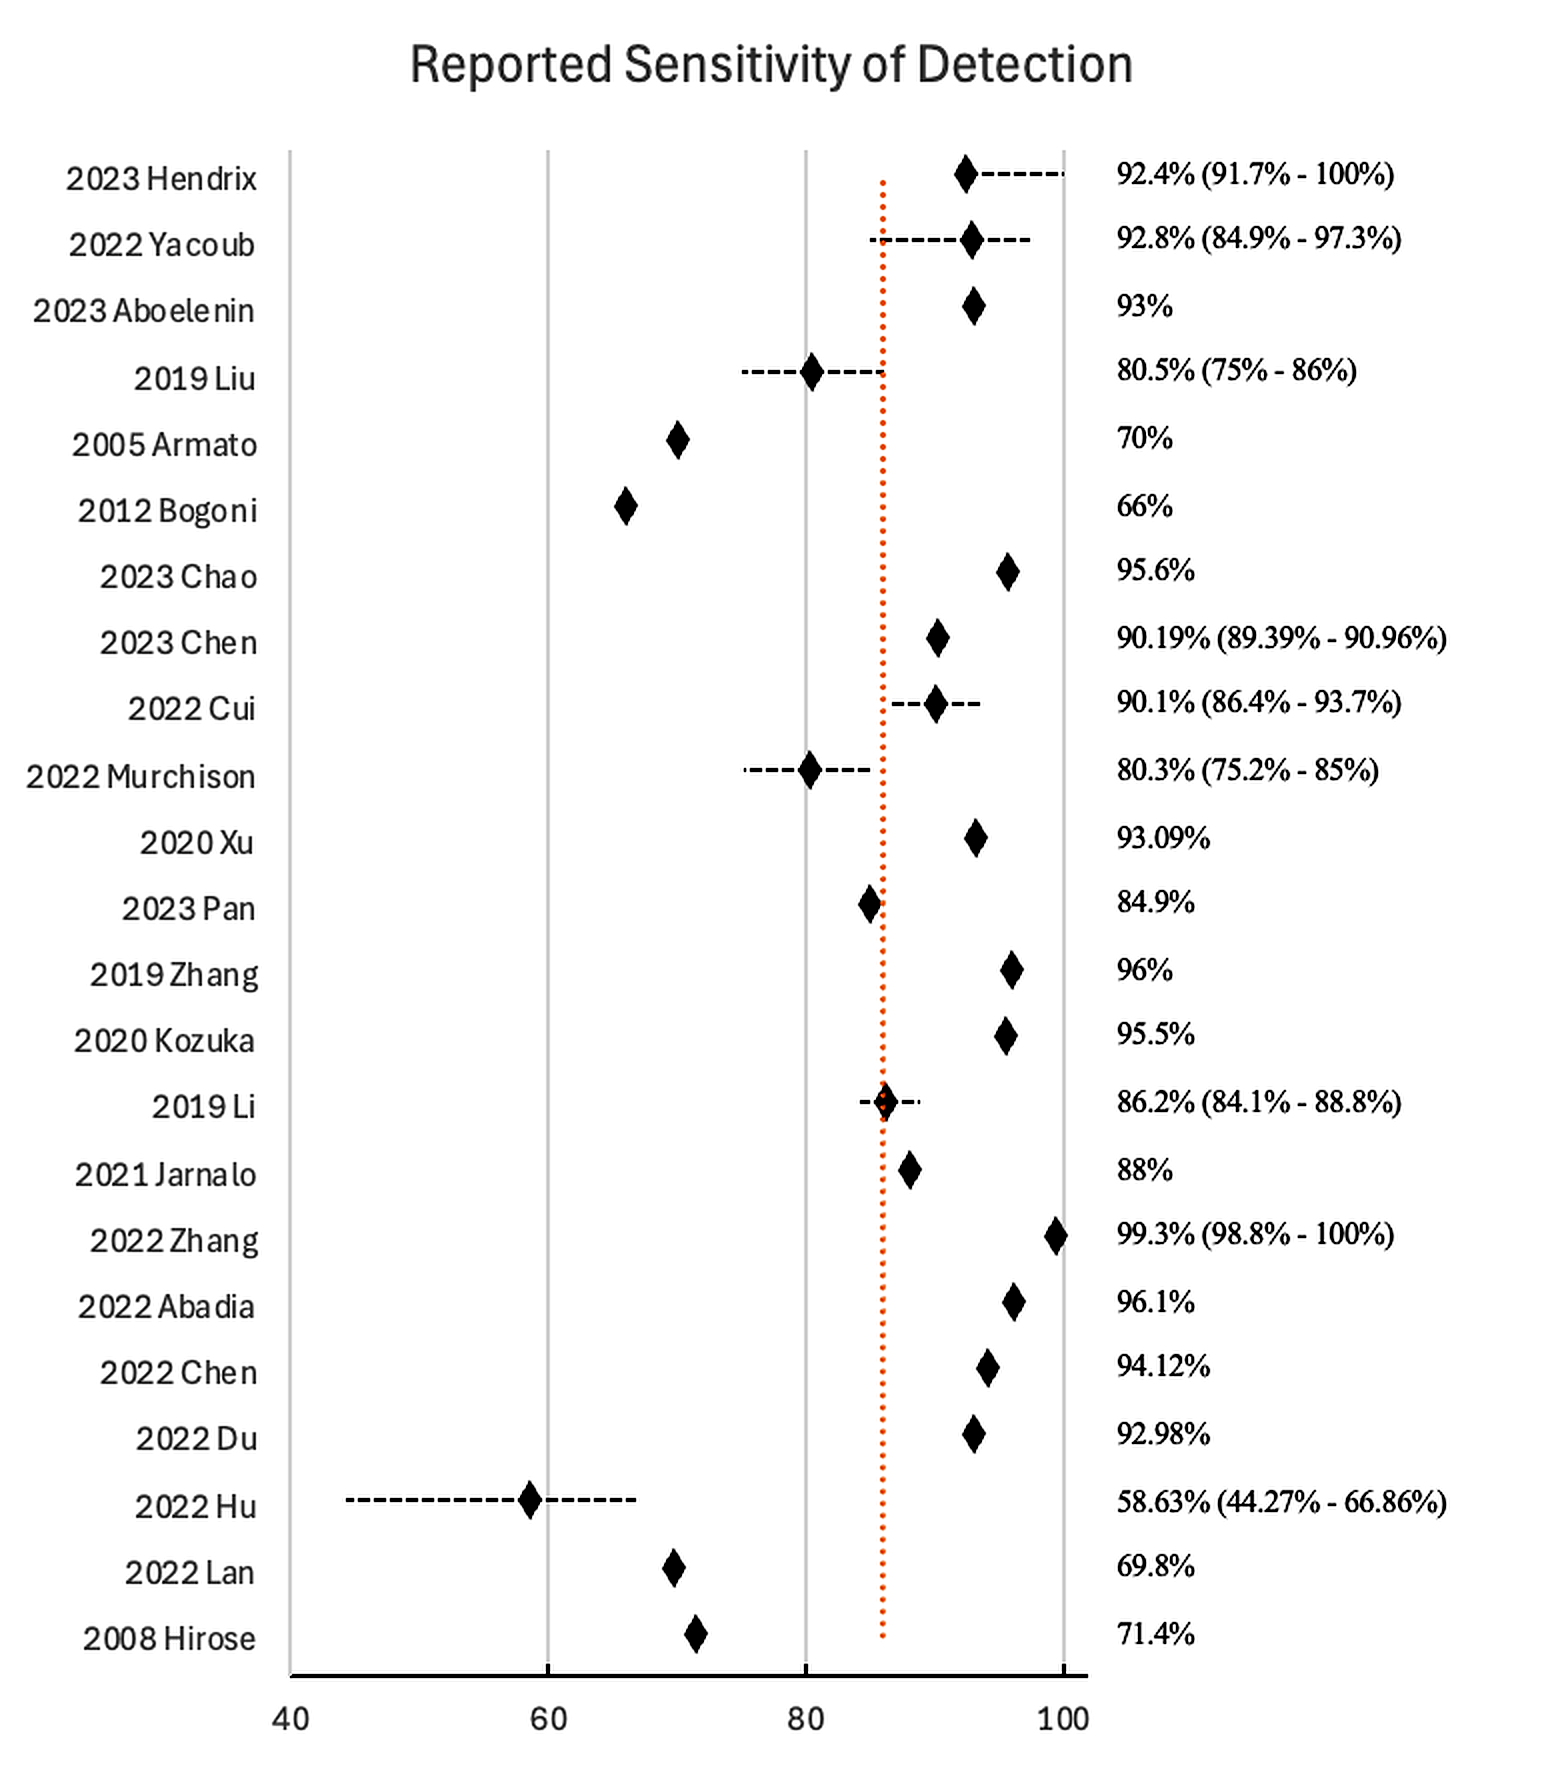
Figure 2:Forest Plot of reported sensitivity and range for AI applications for lung cancer detection. Mean Sens.= 85.95%
Validation setup
The external test methodologies employed across studies were heterogeneous. Most studies conducted retrospective internal tests on datasets derived from a single or a small number of institutions. Three out 23 studies utilized prospective external testing, offering insights of applicability [21,25,33]. The most prevalent external testing practice involved comparing AI-model outputs to radiologist consensus readings as the reference standard, although two studies utilized pathology reports for ground truth determination [31,32]. Methodological transparency regarding the validation datasets was frequently insufficient, with limited reporting on the diversity of patient populations, disease prevalence, or specific inclusion and exclusion criteria. Moreover, descriptions of threshold settings for determining detection sensitivity (e.g., voxel or pixel overlap criteria or minimum size thresholds for nodules) were also inconsistently reported; further complicating cross-study comparisons and clinical interpretation.
Clinical implications
The clinical impact of AI assistance was unevenly explored across studies. Several studies reported that AI improved radiological sensitivity, particularly for small nodules between 3–10 mm. One study [21] found an increase in sensitivity 58.9% to 86.3% for nodules sized 4–6 mm with AI assistance, underlining the potential clinical relevance for early-stage disease. The overall direction of effect is consistent with other studies that showed improved sensitivity for small nodules.
AI integration was frequently reported to enhance diagnostic confidence and reduce variability among radiologists, especially among less experienced readers [23]. Explicit descriptions and discussions regarding workflow integration and resource utilization were generally missing. Four studies [16,18,28,30] quantitatively assessed workflow or resource outcomes such as reading time or additional work-up, beyond diagnostic accuracy.
Discussion
This systematic review investigated the application and diagnostic accuracy of artificial intelligence (AI) models in thoracic CT for lung nodule and lung cancer detection. Of the twenty-three included studies most were published after 2020, reflecting the rapid development in the field. Most models used deep learning and were trained and validated on retrospective hospital-based datasets, suggesting potential real-world applicability but limited prospective evidence was provided.
Our primary effect measure was lesion-level sensitivity; specificity, false positives per scan, and predictive values were treated as secondary outcomes were reported. Across all studies, mean sensitivity was high (aprox. 86%), but estimates were heterogeneous (59.2–98.8%). When restricting to high-quality studies with low risk of bias, sensitivity estimates narrowed to approximately 66–95%, indicating more consistent performance. Specificity also varied widely, and only a subset of high-quality studies reported additional metrics such as false positives per scan and positive predictive value, which generally showed that gains in sensitivity could be achieved without prohibitive increases in false positives. Although similar tendencies were seen in a number of studies, these estimates should be interpreted with caution due to the high risk of bias and low reporting quality observed across many studies.
Risk-of-bias assessment with the modified QUADAS-2 and methodological assessment with MI-CLAIM both highlighted overall concerns regarding patient selection and incomplete reporting of the index test. MI-CLAIM completion averaged about 65% and with frequent gaps in clinical integration, model examination, and reproducibility. Only two studies (Hendrix et al. and Aboelenin et al. [13,15]) combined low risk of bias with detailed, reproducible reporting. Hendrix et al. showed that a deep learning system in a non-screening setting could detect benign nodules, small primary lung cancers, and metastases with sensitivities above 90% at approximately 1 false positive per scan, performing comparably to, or better than, thoracic radiologists. Aboelenin et al. demonstrated that an AI-assisted Lung-RADS workflow in a screening-like cohort achieved very high sensitivity and specificity with excellent agreement with an expert reference radiologist. Together, these studies suggest that, under robust design and reporting conditions, AI can approach or match expert performance while maintaining an acceptable false-positive burden and clinically meaningful positive predictive values.
Data foundation
Dataset biases due to selective populations or inconsistent tumor management protocols were generally inadequately ad-dressed. The use of open-source annotations [21] raises concerns about propagating similar model errors such as misclassification. Many studies lacked external testing, often matching validation closely to training datasets, risking overfitting [26,29]. Small sample sizes in validation cohorts further limited robustness and generalizability [33,34]. Transparency regarding the source of dataset and annotation methods was frequently insufficient, hindering clinical trust and practical implementation.
Important methodological limitations in the included studies should also be recognized.For example, inconsistencies in defining reference standard and detection sensitivity thresholds across studies pose challenges for comparative analyses. Most studies lacked rigorous external testing and comprehensive performance metrics beyond sensitivity and specificity, reducing the robustness of reported outcomes.
In descriptive terms, our findings are broadly consistent with previous literature in suggesting that AI can increase sensitivity for small nodules compared with historical radiologist performance. We did not perform formal meta-analyses, and only a few primary studies reported statistical tests comparing AI-assisted and unaided readings, so these comparisons are not based on statistically pooled estimates and should be interpreted with caution. Even among low–risk-of-bias, moderate-to-high–quality studies, reported sensitivities varied widely; for example, Bogoni et al. [18] reported a CAD-assisted sensitivity of about 66%, illustrating that improved methodology does not uniformly translate into high sensitivity and that case mix, thresholds and reading strategies remain important determinants of observed performance.
This review is subjedt to several noted limitations, including potential selection bias given language restrictions (English only) and the heterogeneity of AI models assessed. However, it provides an overview and analysis of the current methodological and reporting practices in AI lung cancer and lung nodule applications for thoracic CT scans, outlining critical areas requiring standardization and improvement.
To ensure effective implementation of AI solutions into routine clinical practice, uniform standards for training dataset selection, annotation methods, and unbiased external validation practices must be universally adopted.
Conclusions
Across the 23 included studies, adherence to the MI-CLAIM checklist was only moderate, with major gaps in transparency and reduced reproducibility. Among the included studies, AI applications for thoracic CT nodule detection showed generally high but heterogeneous lesion-level sensitivity, while specificity, false-positive rates and predictive values were inconsistently reported. Two studies stood out, Hendrix et al. showed with high quality reporting and low risk-of-bias that AI can approach or match expert performance, while maintaining acceptable FP-burdens. In the remaining studies AI assistance improved detection of small nodules in general, but clinical impact on workflow and downstream management was rarely quantified, and validation and data foundations were weak, with few independent external test sets. Robust and externally validated studies with standardized reporting are therefore required before these systems can be relied on in routine practice.
Registration
Protocol registered with PROSPERO (CRD42024428566).
Conflicts of Interest
The authors have nothing to disclose.
References
1. Barta JA, Powell CA, Wisnivesky JP. Global epidemiology of lung cancer. Ann Glob Health. 2019;85:8.
2. Zhang J, IJzerman MJ, Oberoi J, Karnchanachari N, Bergin RJ, Franchini F, et al. Time to diagnosis and treatment of lung cancer: A systematic overview of risk factors, interventions and impact on patient outcomes. Lung Cancer. 2022;166:27–39.
3. Hanna TP, King WD, Thibodeau S, Jalink M, Paulin GA, Harvey-Jones E, et al. Mortality due to cancer treatment delay: Systematic review and meta-analysis. BMJ. 2020;371:m4087.
4. de Koning HJ, van der Aalst CM, de Jong PA, Scholten ET, Nackaerts K, Heuvelmans MA, et al. Reduced lung-cancer mortality with volume CT screening in a randomized trial. N Engl J Med. 2020;382(6):503–513.
5. National Lung Screening Trial Research Team, Aberle DR, Adams AM, Berg CD, Black WC, Clapp JD, et al. Reduced lung-cancer mortality with low-dose computed tomographic screening. N Engl J Med. 2011;365(5):395–409.
6. Binczyk F, Prazuch W, Bozek P, Polanska J. Radiomics and artificial intelligence in lung cancer screening. Transl Lung Cancer Res. 2021;10(2):1186.
7. Huang S, Yang J, Shen N, Xu Q, Zhao Q. Artificial intelligence in lung cancer diagnosis and prognosis: Current application and future perspective. Semin Cancer Biol. 2023;S1044-579X(23):00068.
8. Chamberlin J, Kocher MR, Waltz J, Snoddy M, Stringer NFC, Stephenson J, et al. Automated detection of lung nodules and coronary artery calcium using artificial intelligence on low-dose CT scans for lung cancer screening: Accuracy and prognostic value. BMC Med. 2021;19(1):55.
9. Thong LT, Chou HS, Chew HSJ, Lau Y. Diagnostic test accuracy of artificial intelligence-based imaging for lung cancer screening: A systematic review and meta-analysis. Lung Cancer. 2023;176:4–13.
10. Logullo P, MacCarthy A, Dhiman P, Kirtley S, Ma J, Bullock G, et al. Artificial intelligence in lung cancer diagnostic imaging: A review of the reporting and conduct of research published 2018–2019. BJR Open. 2023;5(1):20220033.
11. Norgeot B, Quer G, Beaulieu-Jones BK, Torkamani A, Dias R, Gianfrancesco M, et al. Minimum information about clinical artificial intelligence modeling: The MI-CLAIM checklist. Nat Med. 2020;26(9):1320–1324.
12. Whiting PF, Rutjes AWS, Westwood ME, Mallett S, Deeks JJ, Reitsma JB, et al. QUADAS-2: A revised tool for the quality assessment of diagnostic accuracy studies. Ann Intern Med. 2011;155(8):529–536.
13. Hendrix W, Hendrix N, Scholten ET, Mourits M, Trap-de Jong J, Schalekamp S, et al. Deep learning for the detection of benign and malignant pulmonary nodules in non-screening chest CT scans. Commun Med. 2023;3(1):156.
14. Yacoub B, Kabakus I, Schoepf UJ, Varga-Szemes A, Emrich T. Performance of an artificial intelligence-based platform against clinical radiology reports for the evaluation of non-contrast chest CT. J Thorac Imaging. 2021;36(6):W123.
15. Aboelenin NA, Elserafi A, Zaki N, Rashed EA, Al-Shatouri M. Assessment of artificial intelligence-aided computed tomography in lung cancer screening. Egypt J Radiol Nucl Med. 2023;54(1):74.
16. Liu K, Li Q, Ma J, Zhou Z, Sun M, Deng Y, et al. Evaluating a fully automated pulmonary nodule detection approach and its impact on radiologist performance. Radiol Artif Intell. 2019;1(3):e180084.
17. Armato SG 3rd, Roy AS, MacMahon H, Li F, Doi K, Sone S, et al. Evaluation of automated lung nodule detection on low-dose computed tomography scans from a lung cancer screening program. Acad Radiol. 2005;12(3):337–346.
18. Bogoni L, Ko JP, Alpert J, Anand V, Fantauzzi J, Florin CH, et al. Impact of a computer-aided detection system integrated into PACS on reader sensitivity and efficiency for detection of lung nodules in thoracic CT exams. J Digit Imaging. 2012;25(6):771–781.
19. Chao HS, Tsai CY, Chou CW, Shiao TH, Huang HC, Chen KC, et al. Artificial intelligence-assisted CT detection of lung nodules for prognostic cancer examination: A large-scale clinical trial. Biomedicines. 2023;11(1):147.
20. Chen J, Cao R, Jiao S, Dong Y, Wang Z, Zhu H, et al. Application value of a computer-aided diagnosis and management system for detection of lung nodules. Quant Imaging Med Surg. 2023;13(10):6929–6941.
21. Cui X, Zheng S, Heuvelmans MA, Du Y, Sidorenkov G, Fan S, et al. Performance of a deep learning-based lung nodule detection system as an alternative reader in a Chinese lung cancer screening program. Eur J Radiol. 2022;146:110068.
22. Murchison JT, Ritchie G, Senyszak D, Nijwening JH, Van Veenendaal G, Wakkie J, et al. Validation of a deep learning computer-aided system for CT-based lung nodule detection, classification, and growth rate estimation in routine clinical population. PLoS One. 2022;17(5):e0266799.
23. Xu YM, Zhang T, Xu H, Qi L, Zhang W, Zhang YD, et al. Deep learning in CT images: Automated pulmonary nodule detection for subsequent management using convolutional neural network. Cancer Manag Res. 2020;12:2979–2992.
24. Pan W, Fang X, Zang Z, Chi B, Wei X, Li C. Diagnostic efficiency of artificial intelligence for pulmonary nodules based on CT scans. Am J Transl Res. 2023;15(5):3318–3325.
25. Zhang C, Sun X, Dang K, Li K, Guo XW, Chang J, et al. Toward an expert level of lung cancer detection and classification using a deep convolutional neural network. Oncologist. 2019;24(9):1159–1165.
26. Kozuka T, Matsukubo Y, Kadoba T, Oda T, Suzuki A, Hyodo T, et al. Efficiency of a computer-aided diagnosis system with deep learning in detection of pulmonary nodules on 1-mm-thick CT images. Jpn J Radiol. 2020;38(11):1052–1061.
27. Li L, Liu Z, Huang H, Lin M, Luo D. Evaluating the performance of a deep learning-based CAD system for detecting and characterizing lung nodules: Comparison with double reading by radiologists. Thorac Cancer. 2019;10(2):183–192.
28. Martins Jarnalo CO, Linsen PVM, Blazis SP, Van der Valk PHM, Dieckens DBM. Clinical evaluation of a deep-learning-based CAD system for detection of pulmonary nodules in a large teaching hospital. Clin Radiol. 2021;76(11):838–845.
29. Zhang Y, Jiang B, Zhang L, Greuter MJW, De Bock GH, Zhang H, et al. Lung nodule detectability of AI-assisted CT image reading in lung cancer screening. Curr Med Imaging. 2022;18(3):327–334.
30. Abadia AF, Yacoub B, Stringer N, Snoddy M, Kocher M, Schoepf UJ, et al. Diagnostic accuracy and performance of AI in detecting lung nodules in patients with complex lung disease: A noninferiority study. J Thorac Imaging. 2022;37(3):154–161.
31. Chen Y, Tian X, Fan K, Zheng Y, Tian N, Fan K. Value of AI-based film reading system in diagnosis of non-small-cell lung cancer and efficacy monitoring: A retrospective study. Comput Math Methods Med. 2022;2022:2864170.
32. Du W, He B, Luo X, Chen M. Diagnostic value of AI based on CT image in benign and malignant pulmonary nodules. J Oncol. 2022;2022:1–6.
33. Hu Q, Wang S, Chen C, Kang S, Sun Z, Wang Y, et al. Comparison of two reader modes of CAD in lung nodules on low-dose CT scan. J Innov Opt Health Sci. 2022;15(2):2250013.
34. Lan CC, Hsieh MS, Hsiao JK, Wu CW, Yang HH, Chen Y, et al. Deep learning-based AI improves accuracy of error-prone lung nodules. Int J Med Sci. 2022;19(3):490–498.
35. Hirose T, Nitta N, Shiraishi J, Nagatani Y, Takahashi M, Murata K. Evaluation of CAD software for detection of lung nodules on multidetector row CT. Acad Radiol. 2008;15(12):1505–1512.
Supplementary Material
Supplementary material is available online, including Appendix A (search strings), Appendix B (risk-of-bias checklists), and Appendix C (full list of extracted variables).
● Appendix A: Search strings.
● Appendix B: Quality assessment/risk-of-bias checklists.
● Appendix C: Full list of extracted variables.
Received: February 25, 2026;
Accepted: March 15, 2026;
Published: March 18, 2026
.
To cite this article : Duedahl F, Delhez SM, Rasmussen BSB, Stenger M. Artificial Intelligence for Nodule Detection in Thoracic Computed Tomography: A Systematic review and Structural Analysis Based on the MI-CLAIM Model. Br J Cancer Res. 2026; 9(1): 848- 856. doi: 10.31488/bjcr.214
© The Author(s) 2026. This is an open access article distributed under the terms of the Creative Commons Attribution License (https://creativecommons.org/licenses/by/4.0/).