Research article / Open Access
DOI: 10.31488/bjcr.201
Changes in the Resonance Frequency of the Middle Ear without Opening the Eustachian Tube
Tino Just1, Moayad Anbari1, Axel Monien1,2, Dörte Fischer1,2
1. Department of Otorhinolaryngology, Head and Neck Surgery, KMG Klinikum, Güstrow, Germany
2. Department of Audiology, KMG Klinikum, Güstrow, Germany
*Corresponding author: Tino Just, M.D, Department of Otorhinolaryngology, Head and Neck Surgery Friedrich-Trendelenburg-Allee 1 D-18273 Güstrow, Germany
Abstract
Objective: This study aimed to assess whether reso-nance frequency changes occur with induced pressure variations in the middle ear using pressure-less acoustic immit-tance measurements. Subjects and Methods: PLAI and tympanometric measurements were conducted on three healthy volunteers who kept their Eustachian tubes closed for as long as possible. The results were compared to meas-urements taken during the day, following the Valsalva and Toynbee maneuvers. Results: Serial measurements from all three participants demonstrated a continuous decrease in middle ear pressure, as indicated by tympanometry (∆p = -30 daPa to -54 daPa), alongside an increase in resonance frequency over time. A moderate to strong negative correlation was observed between the frequency measures and the TPP values. Both the Valsalva and Toynbee maneuvers, which induce under- and over-pressure in the middle ear, increased the stiffness of the tympanic membrane and the ossicular chain. However, tympanometry type A and PLAI diagnoses of “normal finding” remained unchanged. Conclusions: PLAI measurements displayed an opposite pattern compared to tympanometric measurements. Significant artificial changes in middle ear pressure (the Toynbee and Valsalva maneuvers) resulted in increased stiffness of the tympanic membrane and ossicular chain, with greater stiffness observe following the Valsalva maneuver. Avoiding the opening of the Eustachian tube caused a continuous increase in resonance frequency due to increased stiffness.
Introduction
Wideband admittance measurement, introduced in the early 1980s, was developed to improve the differentiation of various middle ear pathologies compared to single-frequency tympanometry [1]. While tympanometry primarily monitors pressure conditions within the middle ear, WAI provides parameters such as resonance frequency (RF) and peak admittance. Modern devices measure these parame-ters and generate diagnoses such as “soft,” “perforation,” “normal,” and “stiff/OME” [2]. Previous pilot studies found that patients with ventilation problems, such as retraction of the tympanic membrane, showed variable results influ-enced by factors such as the thickness of the tympanic membrane, the degree and localization of the retraction pocket, and the presence of adhesion [2]. Even within a single eardrum, atrophic areas, calcifications, and scars can be present. Additionally, ossicular chain disconnection and fixation can yield contradictory results, suggesting that RF is the final outcome of various conditions affecting the outer ear canal, tympanic membrane, and middle ear. Therefore, interpret-ing single parameters may not enhance the differentiation of various middle ear conditions.
This study examines whether pressure-less acoustic im-pedance (PLAI) measurements can monitor the increasing stiffness of the eardrum caused by artificially induced un-der-pressure in the middle ear. The investigation builds on a simple, noninvasive self-experiment conducted by Pau et al. in 2009 [3]. In that experiment, volunteers refrained from swallowing for 20–120 minutes to keep the Eustachian tube closed. Single-frequency tympanometry revealed that in all three subjects, middle ear pressure decreased by up to 150 daPa over time. These findings supported experimental data from animal models that demonstrated bidirectional gas exchange through the middle ear mucosa.The goal of the present study is to determine whether RF changes with artificially induced variations in middle ear pressure.
Materials and Methods
Three volunteers (authors M.A., A.M., and T.J.) partici-pated in the study. All three had normal-appearing tympanic membranes, normacusis, and clean, moderately wide outer ear canals. Both ears were tested, but only the results from one ear were presented.
The participants were positioned upright, and their tongues were stretched out and gently fixed with their front teeth and lips. A cotton compress was placed under the tongue, hanging partly out of the mouth to drain saliva. Participants were instructed not to swallow and to avoid any movement of the soft palate for as long as possible. The experiment concluded immediately after swallowing. The experimental setup closely resembled that of the 2009-study. However, since we found that the Valsalva maneuver might change the RF [2], we avoided equalizing middle ear (ME) pressure while performing the Toynbee (pinching the nose and swallowing) or Valsalva maneuver (a forceful exhalation against a closed airway) before starting the experi-ment. Thus, an ME pressure of 0 daPa ± 10 daPa was not a prerequisite for initiating the experiment.
PLAI measurements were conducted first, followed by tympanometric measurements at five-minute intervals. Both measurements were recorded.
To reliably interpret the results, additional separate meas-urements were taken for one subject after the Toynbee and Valsalva maneuvers throughout the day, from 8 a.m. to 3 p.m., every hour. Blank measurements were taken without equalizing the ME pressure, followed by measurements after both the Toynbee and Valsalva maneuvers.
PLAI (Pressure-Less Acoustic Immit-tance)
The end of a MedWave® probe was inserted into the lateral portion of the external ear canal. This test system applied a signal ranging from 100 to 3000 Hz. Evaluating the responses resulted in the calculation of the complex acoustic admittance. MedWave® provides objective numerical values: the frequency at which the maximum value of the admittance curve occurs (Fr [Hz]) and peak admittance value (P [*10-2 mmho]).
Conventional Tympanometry
Tympanometry was performed using the Madsen® Zo-diac (type 1096; Otometrics) at 226 Hz from -400 to +200 daPa. The following results were used for calculation: tym-panometric peak pressure (TPP), tympanic width (TW), equivalent ear canal volume (ECV), and static peak compli-ance (SC).
Statistical analysis
To measure the stability and precision of the PLAI and conventional measurements, Cronbach’s reliability statistic was performed. Statistical tests (Kolmogorov test and Shapiro-Wilk test) indicated a non-normal distribution for all parameters, with all p-values < 0.05. Pearson statistic was used for the correlational analyses. The alpha level was set at 0.05. SPSS version 30.0 (SPSS Inc., Chicago, IL, USA) was used for the statistical analyses.
Results
Figure 1 shows the pressure development over a period of 128 minutes for subject 1, ranging from +2 daPa to -52 daPa (∆p = -54 daPa). The corresponding course of the RF is presented in Figure 2, ranging from 371 Hz to 431 Hz. A fairly strong negative correlation was found between the fre-quency measures and the TPP values (r27 = -0.876, p < 0.001).
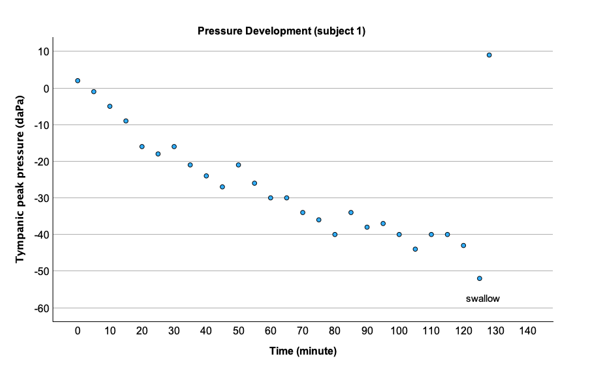
Figure 1:Pressure development without swallowing in subject 1.

Figure 2:Resonance frequency development without swallowing in subject 1.
Measurements for subjects 2 and 3 began at TPP values of approximately 40–45 daPa. A similar trend in both RF and TPP measures for subject 2, RF, and TPP, is presented in Figures 3 and 4. Within 110 minutes, we observed a TPP shift of ∆p = -30 daPa, while the frequency increased to 420 Hz. Correlational analyses revealed a moderate negative correlation between the frequency measures and the TPP values (r23 = -0.695, p < 0.001).
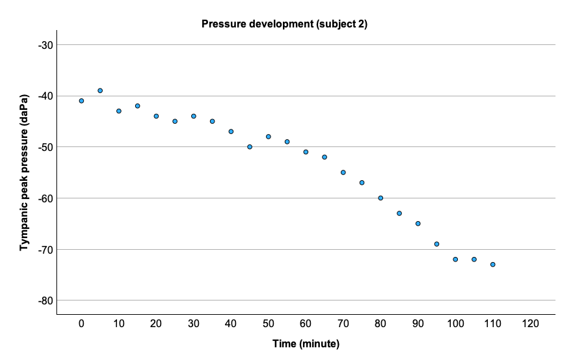
Figure 3:Pressure development without swallowing in subject 2.
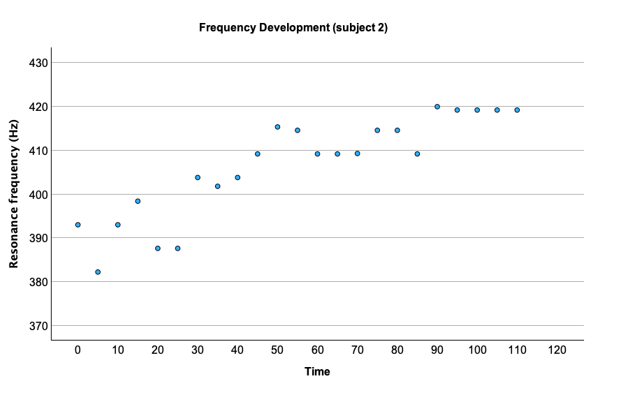
Figure 4:Resonance frequency development without swallowing in subject 2.
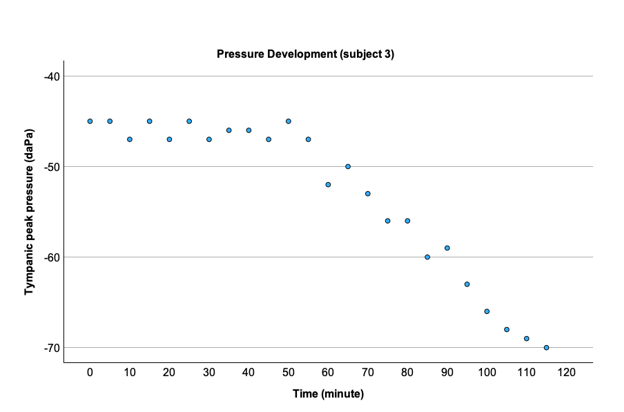
Figure 5:Pressure development without swallowing in subject 3.
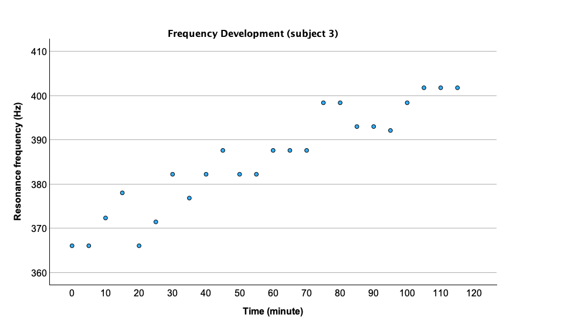
Figure 6:Resonance frequency development without swallowing in subject 3.
For subject 3, the under-pressure increased from -45 daPa to -70 daPa (∆p = -25 daPa) over a period of 110 minutes, while the RF increased from 366 Hz to 401 Hz. Correlation-al analyses revealed a fairly strong negative correlation between the frequency measures and the TPP values (r24 = -0.851, p < 0.001).
Figures 7 and 8 demonstrate both the blank values of RF and TPP and the values after the Toynbee and Valsalva maneuvers. The mean RF (341 Hz ± 7.00 Hz) increased after the Toynbee maneuver (359 Hz ± 17.9 Hz) and the Valsalva maneuver (392 Hz ± 17.3 Hz), while the TPP changed differently.
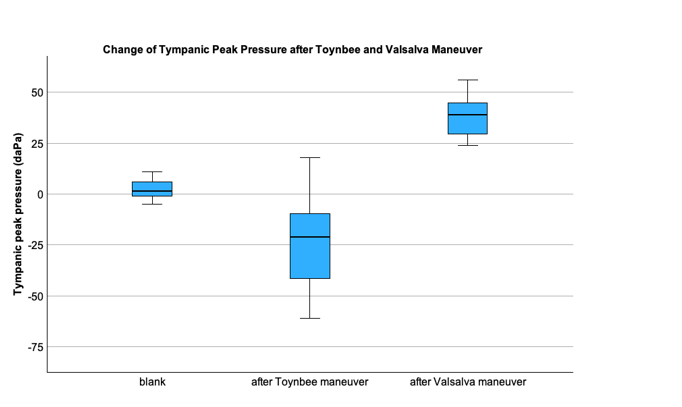
Figure 7:Tympanic pressure peak development after the Toynbee and Valsalva maneuvers.
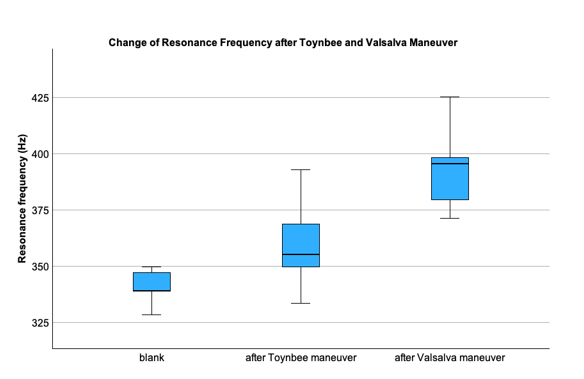
Figure 8:Resonance frequency development after the Toynbee and Valsalva maneuvers.
Discussion
The serial tympanometric measurements of a single sub-ject revealed that changes in ME pressure throughout the day corresponded with RF (blank, Figures 7 and 8). Under normal conditions, large variations in gas pressure and volume are not expected, as gas ventilation through the Eusta-chian tube compensates for gas exchange through the mucosa. This state is known as the steady-state situation of the ME [4-6]. Our tympanometric measurement findings align with direct ME pressure measurements conducted over 24 hours in 1999 [7]. The pressure recordings were taken from the ME via a tympanic membrane perforation in patients with a patulous Eustachian tube. The study found that ME pressure varied during the day and night, indicating that Eustachian tube function changed over time from a closed to an open state. Patients with a patulous Eustachian tube exhibited a long-term pressure pattern significantly different from that of the normal group [7]. In a recumbent position during the night, normal subjects demonstrated a slight positive mean pressure, while patients with a patulous Eusta-chian tube exhibited negative pressure more frequently.
Artificial maneuvers, such as the Toynbee and Valsalva maneuvers, led to the expected large variations in gas pressure and volume. While the Toynbee maneuver decreased ME pressure, the Valsalva maneuver increased it. Both maneuvers resulted in an increase in RF due to the increased stiffness of the tympanic membrane and the ossicular chain caused by artificial changes in ME pressure. These find-ings suggest that RF measures are not strongly related to tympanometric measures.
The question arose as to whether RF correlates with ME pressure when subjects avoid swallowing. Previous studies in humans have shown that ME pressure is influenced by the frequency of swallowing actions [4-6]. During sleep, swallowing actions decrease, leading to a reduction in ME pressure. In contrast, other studies have demonstrated an increase in ME pressure during sleep, linking it to sleep itself rather than the number of tube openings [8]. Pau et al. conducted a simple experiment showing that ME pressure decreases if the Eustachian tube does not open [3]. Animal experiments have shown alterations in ME gas or pressure, describing a three-phase course of changes: a primary transient increase in nitrogen, followed by a linear decrease (phase II), and finally a gradual decrease (phase III) [9]. In this experiment, the ME was flushed with pure nitrogen or room air, result-ing in a disturbed ME gas composition. In the present study, the steady state remained unchanged. No equalization of ME pressure was performed before measuring pressure and RF. Therefore, we assumed a steady-state situation be-tween gas composition, pressure, and volume for all three volunteers prior to testing. In this experiment, we found a linear pressure decrease corresponding to phase II in all three healthy subjects but no phase I. Phase III was observed in one subject (subject 3) after 60 minutes without swallowing, which may be attributed to ME mucosal reactions [9].
In daily practice, single-frequency tympanometry is commonly used to analyze the pressure condition of the ME. However, this method’s accuracy is poor [10-11]. Cina-mon and Sade demonstrated in a model with a larger “mastoid” that tympanometry measurements can be unreliable, with errors ranging from 20% to 40%. Even in a model with a small mastoid and slightly negative ME pressure, they found an error of more than 400% [10]. They concluded that tympanometry does not accurately reflect ME pressure, especially in patients with chronic otitis media, which is characterized by small and often unaerated mastoids, resulting in small negative pressures. Since tympanometry measures the ECV when the tympanic membrane is intact, and addi-tionally the volume of the ME cavity and mastoid cells in patients with tympanic membrane perforation, the question arose as to whether ME aeration, as measured by tympanometric volume in those patients, could predict tympano-plasty success. Ribeiro et al. found significantly higher interaural tympanometric volumes in the surgical success group compared to the failure group [12]. The authors subtracted the volume of the healthy ear from the affected ear, reach-ing the volume of the ME and mastoid. They concluded that greater interaural volume differences, which indicate better aeration of the ME and mastoid, may predict the success of type I tympanoplasty. However, other authors found no influence of mastoid ventilation on the success of type I tympanoplasty [13].
In contrast to direct measurement of ME pressure, tym-panometry provides high negative readings in patients with secretory otitis media [11]. The discrepancies in measuring ME pressure have been explained by the volume displacement of the tympanic membrane according to Boyle's Law. Using an ME model, researchers demonstrated that tympanometrically estimated pressure decreased by approximate-ly 38 daPa when ME volume changed from 21 to 1 cm³. These findings explain why negative tympanometric record-ings and B curves can be found in ears with normal pressure due to small ME volumes. Additionally, in patients with chronic otitis media, air replacement with effusion occurs [11]. This finding also explains the discrepancy between direct and tympanometric measurements. Similar findings were demonstrated by Anbari et al. Healthy subjects with normal-appearing tympanic membranes and normal hearing ability exhibited abnormal tympanogram types in a small percentage of cases [2,14]. Interestingly, PLAI measurements indicated that subjects with tympanogram type B had increased RF, while those with tympanogram type Ad had decreased RF, corresponding to increased and decreased stiffness of the tympanic membrane, respectively. Therefore, the question arose as to whether PLAI can provide addi-tional information about the ME beyond tympanometry. To investigate this, a simple experiment from 2009 was re-peated. Restricting swallowing for approximately two hours demonstrated a moderate to strong negative correlation between PLAI measures and tympanometric measurements. With a slight decrease in ME pressure, the RF slightly increased, resulting in higher stiffness of the tympanic membrane due to a linear decrease in nitrogen within the ME. These subtle changes in RF altered the PLAI diagnosis of neither the “normal” nor the tympanogram type A.
Limitations
1. The extent of changes in tympanometric and PLAI measures appears to vary among human subjects. Therefore, a larger sample size is needed to validate the results.
2. Equalizing ME pressure before starting the meas-urements may yield different findings within the first 10–20 minutes.
3. Our findings suggest that in normal ears, artificially induced under-pressure correlates with a slight increase in stiffness of the tympanic membrane and the ossicular chain. However, this does not imply that under-pressure in healthy, unaerated ears is followed by increased RF.
4. Various pathologies of the ME and/or tympanic membrane may lead to different results.
Ethical Considerations
The Ethics Committee of the General Medical Council of Mecklenburg-West Pomerania approved the study design (A2024-0183). This prospective study was conducted in strict adherence to the revised version of the Helsinki Declaration and is registered with the German Register of Clinical Stud-ies (DRKS 00035288).
Conclusions
PLAI measurements show a pattern opposite to tympa-nometric measures. Strong artificial changes in ME pressure (the Toynbee and Valsalva maneuvers) resulted in in-creased stiffness of the tympanic membrane and the ossicular chain, with greater stiffness observed after the Valsalva maneuver. Avoiding the opening of the Eustachian tube led to a continuous increase in RF, indicating increased stiff-ness. These findings should be considered when interpreting single PLAI measures in patients with various ear patholo-gies.
References
1. Stinson MR, Shaw EA, Lawton BW. Estimation of acoustical energy reflectance at the eardrum from measurements of pressure distribution in the human ear canal. J Acoust Soc Am. 1982;72(3):766-73.
2. Anbari M, Zhumabaeva S, Beishenova M, Fischer D, Sulaimanov S, Just T. Comparison of conventional single-frequency tympanometry with pressure-less acoustic immittance measurements of pathological and normal middle ears. On J Otolaryngol & Rhinol. 2024;7(2):1-11.
3. Pau HW, Sievert U, Just T, Sade J. Pressure changes in the human middle ear without opening the eustachian tube. Acta Otolaryngol. 2009;129(11):1182-6.
4. Mover-Lev H, Sade J, Ar A. Rate of gas exchange in the middle ear of guinea pigs. Ann Otol Rhinol Laryngol. 1998;107(3):194-8.
5. Sade J, Luntz M, Levy D. Middle ear gas composi-tion and middle ear aeration. Ann Otol Rhinol Laryngol. 1995;104(5):369-73.
6. Sade J, Ar A. Middle ear and auditory tube: middle ear clearance, gas exchange, and pressure regulation. Otolaryngol Head Neck Surg. 1997;116(4):499-524.
7. Tideholm B, Carlborg B, Brattmo M. Continuous long-term measurements of the middle ear pressure in subjects with symptoms of patulous eustachian tube. Acta Otolaryngol. 1999;119(7):809-15.
8. Tideholm B, Brattmo M, Carlborg B. Middle ear pressure: effect of body position and sleep. Acta Otolaryngol. 1999;119(8):880-5.
9. Kania RE, Herman P, Tran Ba Huy P, Ar A. Role of nitrogen in transmucosal gas exchange rate in the rat middle ear. J Appl Physiol (1985). 2006;101(5):1281-7.
10. Cinamon U, Sade J. Tympanometry versus direct middle ear pressure measurement in an artificial model: is tympanometry an accurate method to measure middle ear pressure? Otol Neurotol. 2003;24(6):850-3.
11. Gaihede M. Middle ear volume and pressure effects on tympanometric middle ear pressure determination: model experiments with special reference to secretory otitis media. Auris Nasus Larynx. 2000;27(3):231-9.
12. Ribeiro CA, Azevedo CC, Miranda DA, Mar FM, Pereira SM, Vilarinho SS, et al. Could tympanometry volume be a useful tool to predict the success of type I tym-panoplasty in simple chronic otits media. Int J Otorhinolaryngol. 2023;9(2):142-6.
13. Keskin S, Tatlipinar A, Kinal E. Do Decreased Mas-toid Pneumatization, Bilateral Involvement and Eustachian Tube Function Affect the Success of Type 1 Tym-panoplasty? Indian J Otolaryngol Head Neck Surg. 2024;76(1):979-86.
14. Anbari M, Zhumabaeva S, Beishenova M, Fischer D, Sulaimanov S, Just T. Pressure-less acoustic immittance measurements of patients with persistent ventilantion disorders. On J Otolaryngol & Rhinol. 2025; 7(3): 1-11.
Received: January 02, 2025;
Accepted: January 27, 2025;
Published: January 29, 2025.
To cite this article : Just T, Anbari M, Monien A, Fischer D. Changes in the Resonance Frequency of the Middle Ear without Opening the Eustachian Tube. British Journal of Cancer Research. 2025; 8(1): 742- 746. doi: 10.31488/bjcr.201.
© The Author(s) 2025. This is an open access article distributed under the terms of the Creative Commons Attribution License (https://creativecommons.org/licenses/by/4.0/).