Research article / Open Access
DOI: 10.31488/bjcr.202
Rapid Noninvasive Skin Screening for Basal Cell Carcinomas using Vibrational Optical Coherence Tomography
Frederick H. Silver1,2, Tanmay Deshmukh2, Aanal Patel1, Jimmy Dhillon1, Anika Bobra2, Hari Nadiminti3
1. Department of Pathology and Laboratory Medicine, Robert Wood Johnson Medical School, Rutgers, the State University of New Jersey, Piscataway, NJ 08854, USA
2. OptoVibronex, LLC., Ben Franklin Tech Ventures, Bethlehem, PA 18105, USA
3. Summit Health, Dermatology, Berkeley Heights, NJ 07922, USA
*Corresponding author:Frederick H. Silver. Department of Pathology and Laboratory Medicine, Robert Wood Johnson Medical School, Rutgers, the State University of New Jersey, Piscataway, NJ 08854, USA.
Abstract
Basal cell carcinoma is the leading form of cancer seen in humans. Although it is not difficult to diagnose by most Dermatologists, it is important to provide an early diagnosis to improve treatment outcomes. We have developed a technique termed vibrational optical coherence tomography that uses infrared light and sound to noninvasively differentiate between benign and cancerous skin lesions. In this paper we explore the use of quantitative pixel intensity data in the form of images and pixel intensity versus depth plots to differentiate between basal cell carcinomas and benign and other cancerous skin lesions. Since OCT images can be collected and analyzed remotely, this technique can be used in teledermatology. Our results suggest that green (low intensity) and blue (medium intensity) channel OCT images provide noninvasive information on cellular and melanin aggregates (green channel) and large diameter collagen fibers (blue channel) that can be used to differentiate between cancerous and benign skin lesions. Machine learning study results suggest that the maximum pixel intensity and the pixel intensity measurements at the half width made from a plot of pixel intensity versus depth can be used to identify basal cell carcinoma with a sensitivity and specificity between 80% and 100%. These results suggest that noninvasive OCT measurements in conjunction with visual inspection and dermoscopy can be used as methods to screen patients for cancerous lesions especially lesions with melanin particles and inflammatory components.
Keywords: Basal cell carcinoma, squamous cell carcinoma, seborrheic keratoses, melanoma, melanin, collagen, pixel intensity, melanin aggregates, fibrosis
Introduction
Basal cell carcinoma (BCC) is the most common type of cancer in the United States and is a result of mutations in the lowest layer of the epidermis [1-5]. There are more than 26 types of BCC reported with three types most prevalent including nodular, superficial, and sclerotic (morpheaform) [6]. The incidence of BCC ranges from 4%-8% of the US population with the increased incidence thought to be due to sun exposure [1]. About 80% of the skin cancers treated clinically are BCCs [2] with the most common locations being sun-exposed areas, such as the head, neck, and trunk [3].
Risk factors include light colored skin with Fitzpatrick skin types I and II, light eye colors including blue, green and hazel, light hair colors including blond and red, a history of severe sunburns, immunosuppression, and exposure to carcinogens [1]. Dermoscopy and visual inspection are used to noninvasively diagnose BCC [7,8] with correlation between images seen by these techniques being reported [7]. Varying sensitivities and specificities have been reported with values as high as 99% [8].
Nodular BCCs are observed in 60%-80% of the cases and are most often found on the head [9,10]. Gross clinical presentation of this type of lesion is an elevated pearl-shaped growth with peripheral permanently enlarged bloo d vessels appearing as red or pink lines on the skin [11]. In some cases, arborized/branched vessels are seen with ulceration, blue dots, and globular structures. Histologically, these lesions are seen as clusters or nests of islands of cells tightly packed and surrounded by a layer of highly organized cells surrounded by stroma [11].
Superficial BCC makes up about 10%-30% of cases seen and appears as a red, flat plaque that can vary from several mm to as large as 10 cm with a pearl shaped edge and may exhibit superficial erosion [10]. They are characterized by the presence of maple leaf-like areas (peripheral radial lines), superficial fine telangiectasias (thin vessels), multiple small erosions, white and red structureless areas seen by dermoscopy [11]. Histologically, they make up 10%-30% of BCC lesions exhibiting subdermal nests of basaloid cells. They exhibit a connection to the basal layer of the epidermis with no invasion into the reticular dermis [10]. While nodular, superficial and sclerotic BCCs exhibit different morphologies, a recent study using vibrational optical coherence tomography study suggested that the mechanovibrational spectrum of all three types of BCCs was similar suggesting that similar cellular, dermal collagen, blood vessels, and fibrotic tissue components were present and just the distribution and morphology of these elements differed [12].
Dermoscopy and visual inspection have been used to noninvasively screen suspicious skin lesions. Dermoscopy improves the diagnosis of benign and malignant cutaneous neoplasms in comparison with examination with the unaided eye and is used routinely for all pigmented and non-pigmented cutaneous neoplasms [13-30]. Optical coherence tomography (OCT) has also been used to identify skin cancers [31-37]. Clinical applications of OCT and other techniques include detection of nonmelanoma skin cancer and evaluation of therapy for inflammatory and connective tissue diseases [31-41]. It also has been reported to be used to evaluate malignant melanomas, basal cell, and squamous cell carcinomas [31-37]. OCT imaging has the potential to serve as an objective, non-invasive measure of disease progression for use in both research trials and clinical practice [34-37].
OCT is an imaging technique that applies infrared light to the skin; the light penetrates without causing tissue changes [12-41]. While OCT images alone are useful for visual interpretation of skin lesions, additional quantitative information is contained in the images such pixel intensity differences that can be used to differentiate between skin cancers [38-41].
The purpose of this paper is to use OCT images and pixel intensity measurements to quantitatively differentiate between BCC and other skin lesions noninvasively. This will aid in rapid screening of skin lesions and assist the medical practitioner in minimizing unnecessary biopsies that are costly. This will also improve patient compliance with skin screening especially for subjects with blue, green, and hazel eye colors since the technique does not require touching the skin and it can also be done remotely using telemedicine.
Methods
Oct image collection
Images of control skin and suspected skin cancers were collected using an OQ Labscope 2.0 as described previously operating at a wavelength of 840 nm [12]. The measurements were made in vivo on intact skin and skin lesions as well as in vitro on skin lesion biopsies. All images were made as part of IRB approved clinical studies of 50 samples of BCC (including all subtypes of BCCs), 35 of normal skin, 30 seborrheic keratoses, 39 melanomas, and 23 squamous cell carcinomas. The clinical studies were conducted at both Summit Health and Robert Wood Johnson Medical School. Clinical diagnoses were made by board certified dermatopathologists as part of routine clinical skin excisional protocols. Raw image OCT data were collected and processed using MATLAB software and image J [12]. All OCT images were scanned through the lesion cross-section parallel to the surface to create pixel intensity versus depth profiles as reported previously [12]. The following quantitative parameters derived from the pixel intensity versus depth plots of each specimen were used in machine learning studies to differentiate between different skin samples. (a) The maximum pixel intensity at the surface; and (b) the width of pixel intensity versus depth plot at the half height. The OCT images were broken into green, blue, and red components using Table 1.
Each pixel value in the grayscale OCT images was further evaluated by assigning a unique combination of R-G-B values using the Look Up Table (Table 1). By application of digital image processing algorithms on the color-coded OCT image, the images are split into green, blue, and red channels based on the distribution of pixel intensities. A combination of green, blue, and red colors in varying intensities produce all the colors in the color-coded image; the image processing algorithms map the green, blue, and red, components of each pixel. By breaking up the total image into differences in pixel intensity distribution at each point, it is possible to examine differences in scattering potential of the different layers of skin and skin lesions.
Table 1. Fire Lookup Table (LUT) for color coding the OCT images
| Greyscale value | Red Channel | Green Channel | Blue Channel |
|---|---|---|---|
| 0 | 0 | 0 | 0 |
| 50 | 104 | 0 | 221 |
| 100 | 201 | 7 | 78 |
| 150 | 255 | 129 | 0 |
| 200 | 255 | 219 | 0 |
| 255 | 255 | 255 | 255 |
Machine learning studies
To compare normal skin and lesion OCT images, a pixel intensity profile was obtained from optical coherence tomography (OCT) images as described above. The maximum pixel intensity was determined and the width at the half height was also measured. Additionally, the thickness of each OCT image was measured but found not to be an important parameter. A comprehensive dataset was then compiled, consisting of all extracted parameters. This dataset was then used as input to a logistic regression model. 70% of the data was used to train the model, whereas 30% was used for testing the model.
The model's performance was evaluated by constructing a confusion matrix to calculate its sensitivity and specificity. The following formulae were then applied to derive these metrics:
Sensitivity=a/(a+c)
Specificity=b/(b+d)
| True Positive (a) | False Negative (b) |
| False Positive (c) | True Negative (d) |
The goal of this analysis is to maximize the specificity while minimizing the number of false positives (c). Skin layers containing large aggregates greater than about one tenth of the light wavelength will forward scatter light and appear to have lower surface pixel intensities compared to normal skin [12]. If large lesion aggregates exist, whether they be due to melanin particles, cell aggregates, or large diameter collagen fibers, they may limit light reflection and result in a decrease in OCT image brightness of the epidermis and papillary dermis.
Results
Color-coded OCT Images
When skin lesions were imaged in the OCT scanning mode, a variety of subsurface features were observed including the stratum corneum, basal epithelium, and the papillary dermis. While individual cell details are not visible via conventional OCT, the stratum corneum, basal epithelium, rete ridges, and papillary dermis are seen as described previously [12] (Figure 1A). These layers are easier to observe when the OCT image is color-coded based on the pixel intensity using NIH image J software. Figure 1 shows typical color-coded OCT images of normal skin (A), basal cell carcinoma (B), seborrheic keratosis (C), squamous cell carcinoma (D), and melanoma (E). Note normal skin and SK contains an undulating well defined stratum corneum (yellow) and rete ridges (pink and blue colors). The stratum corneum appears thinner in BCC, SCC, and melanoma.
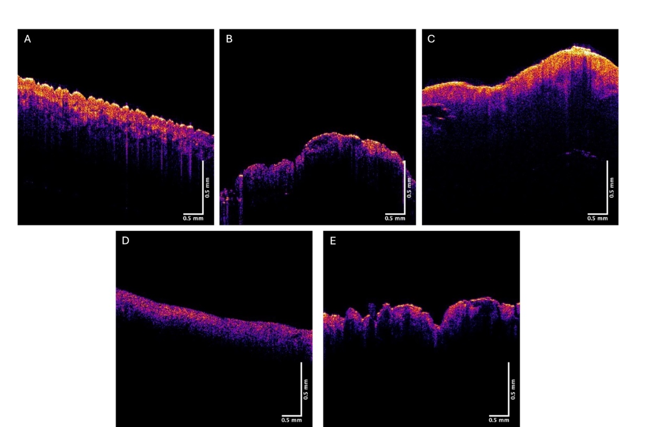
Figure 1:Typical color-coded OCT images of normal skin (A), a nodular BCC (B), a seborrheic keratosis (C), a squamous cell carcinoma (D), and a melanoma (E). Note differences in the amount of yellow stratum corneum between normal skin and SK and BCC, SCC, and melanoma.
Figures 2, 3, and 4 show images created using the different pixel intensities from the green, blue, and red channels generated using Table 1. Figure 5 shows typical plots of pixel intensity versus depth for normal skin (A), a nodular BCC (B), a seborrheic keratosis (C), a squamous cell carcinoma (D), and a melanoma (E). Note the increased pixel intensity for normal skin and SK compared to BCC, SCC, and melanoma and the differences in the shape of the pixel intensity versus depth plots compared to normal skin.
The green, blue, and red channels that are derived from the images shown at low (Figure 2), medium (Figure 3), and high pixel (Figure 4) intensity. Note the green channel for normal skin and SK are easily seen while in comparison the images for BCC, SCC and melanoma are less intense in comparison [42]. The blue channel for normal skin and SK appears to have a hyporeflective region just below the epidermis while that for BCC, SCC, and MEL do not. The red channel for all the samples has similar shapes as that shown for normal skin in Figure 1.
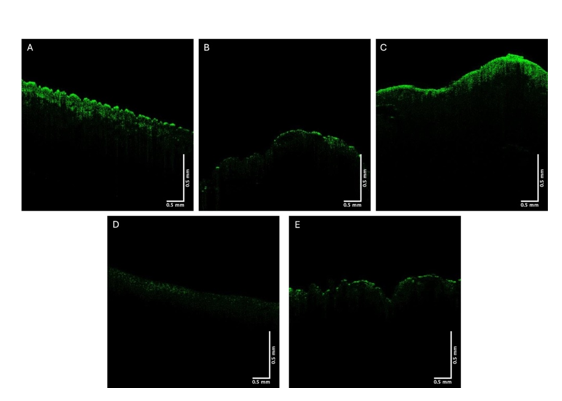
Figure 2:Typical green channel OCT images of normal skin (A), a nodular BCC (B), a seborrheic keratosis (C), a squamous cell carcinoma (D), and a melanoma (E). Note differences between green channel image intensities of normal skin and SK and BCC, SCC, and melanoma.
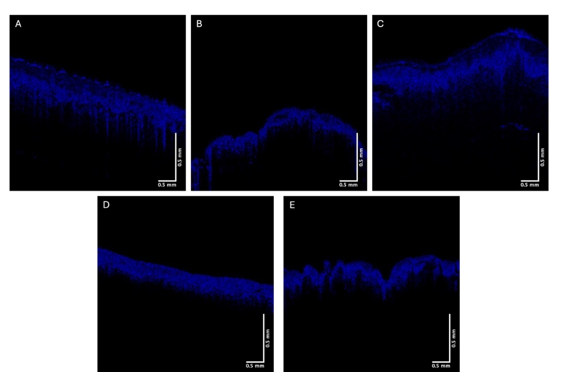
Figure 3:Typical blue channel OCT images of normal skin (A), a nodular BCC (B), a seborrheic keratosis (C), squamous cell carcinoma (D), and melanoma (E). Note differences in the intensity of hyporeflective regions below the epidermis in normal skin and SK compared to BCC, SCC, and melanoma
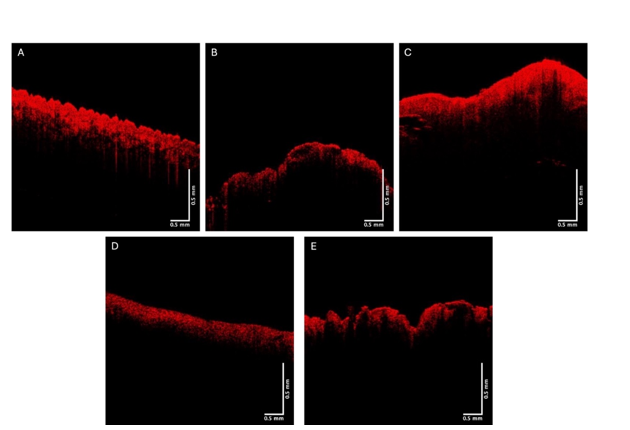
Figure 4: Typical red channel OCT images of normal skin (A), a nodular BCC, a seborrheic keratosis (C), a squamous cell carcinoma (D), and a melanoma (E). Note similarity in intensity to images in Figure 1.
Figure 5 shows typical plots of pixel intensity versus depth created by scanning the color-coded images in Figure 1 parallel to the surface. Note the differences in maximum heights and width of the different plots. Figures 6, 7, and 8 show scans of pixel intensity versus depth for the green (Figure 6), blue (Figure 7) and red channels (Figure 8) derived from Figures 2, 3, and 4, respectively. Note the differences in shape and height between the green channel pixel intensity versus depth profiles of normal skin and SK and that of the skin cancers (Figure 6). Figure 7 illustrates the biphasic blue channel pixel intensity versus depth plots for normal skin and SK compared to the single-phase plots of skin cancers. These differences are less apparent in the red channel (Figure 8) which is similar in shape and size to Figure 1.
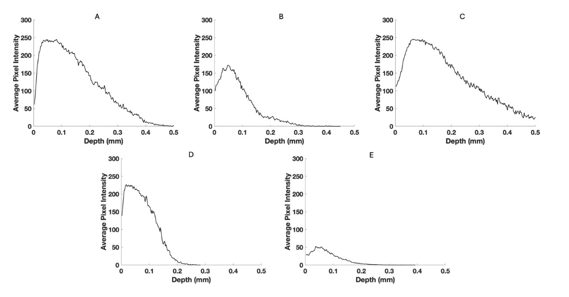
Figure 5:Typical pixel intensity versus depth plots for normal skin (A), a nodular BCC, a seborrheic keratosis (C), a squamous cell carcinoma (D), and a melanoma (E) based on Figure 1. Note the difference in shape and size of the plot seen in melanoma.
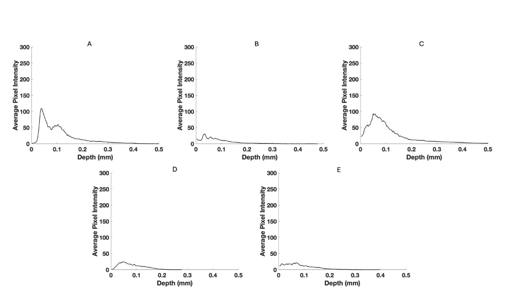
Figure 6:Typical pixel intensity versus depth for the green channel for normal skin (A), a nodular BCC (B), a seborrheic keratosis (C), a squamous cell carcinoma (D), and a melanoma (E) using data from Figure 2. Note the reduced pixel intensities of BCC, SCC and melanoma compared to normal skin and SK.
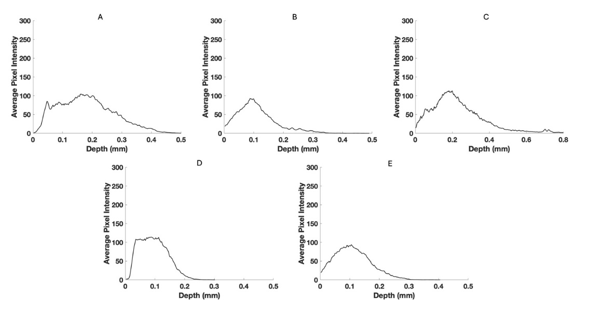
Figure 7:Pixel intensity versus depth for the blue channel for normal skin (A), a nodular BCC (B), a seborrheic keratosis (C), a squamous cell carcinoma (D), and a melanoma (E) from Figure 3. Note the differences in the width at the half-height for normal skin and SK compared to BCC, SCC, and melanoma.
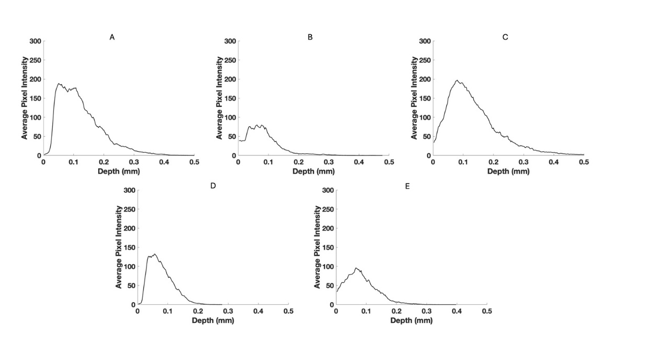
Figure 8:Pixel intensity versus depth for red channel for normal skin (A), a nodular BCC, a seborrheic keratosis (C), a squamous cell carcinoma (D), and a melanoma (E) from Figure 4.
Figures 9 shows confusion matrices for BCCs and the following skin samples; (A) normal skin; (B) seborrheic keratoses; (C) squamous cell carcinomas, and (D) melanomas. Note the use of the maximum pixel height and width at the half-height resulted in a high sensitivity and specificity for differentiating between BCC, normal skin, SK, SCC, and melanoma as shown in Table 2.
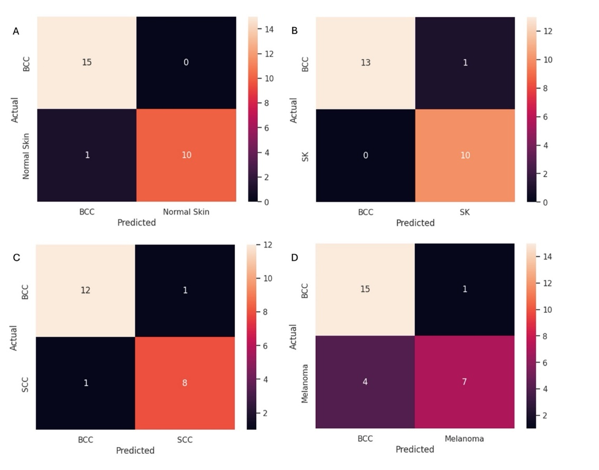
Figure 9:Confusion matrices for BCC versus normal skin (A), seborrheic keratoses (B), squamous cell carcinomas (C), and melanomas (D). Table 2 lists the sensitivity and specificity of differentiating BCC from normal skin, SK, SCC, and melanoma using data from scans of lesions like those shown in Figure 1 and scans shown in Figure 2.
Table 2. Specificity and sensitivity of differentiating between basal cell carcinomas and normal skin (NS), seborrheic keratosis (SK), squamous cell carcinoma (SCC), and melanoma (MEL) using data from lesions like those seen in Figure 1 and scans shown in Figure 2.
| NS | SK | SCC | MEL | |
|---|---|---|---|---|
| Sensitivity | 93.7% | 100% | 92.3% | 78.9% |
| Specificity | 100% | 100% | 88.9% | 87.5% |
Number of samples used: BCC=50, NS=35, SK=30, SCC=23, MEL=39
Discussion
Basal cell carcinoma (BCC) is a keratinocyte carcinoma and represents the most common human cancer [1]. Clinically, invasive BCC generally appears as a hypopigmented plaque or papule, located on the head and neck, the temple, cheek, and tip of the nose. Dermoscopically, invasive BCC frequently displays ulceration and a mix of arborizing branched vessels and superficial fine telangiectasia (blood vessels) [1-6]. One report suggests that collagen distribution is more aligned surrounding BCCs nests compared to normal skin and benign lesions. Collagen was observed to be orientated parallel surrounding indolent BCC subtypes (superficial and nodular) versus less organized for lesions with more aggressive behavior (infiltrative BCC) [39]. While most Dermatologists can easily identify BCCs that do not have pigment or an inflammatory component, it has been reported that BCC is sometimes challenging to recognize clinically, leading to high (~70–80%) rates of false-positive biopsy results [40]. Millions of benign biopsies conducted annually increase morbidity and healthcare costs [40]. Furthermore, a biopsy is an invasive procedure with complications. Most BCCs have a predilection for the facial area, so scar formation following biopsy can cause cosmetic concerns and interfere with vital functions [40]. Histopathology is a time-consuming and tedious procedure due to tissue processing and can delay management. Therefore, any noninvasive technique that can rapidly assist in differentiating benign from cancerous lesions will decrease the cost of healthcare and provide better patient satisfaction.
We have developed a noninvasive technique termed vibrational optical coherence tomography (VOCT) that combines the use of OCT with the application of vibrational analysis [12- 42]. OCT yields a lesion image and VOCT provides quantitative information on the cellular, blood vessel, fibrotic tissue composition, and lesion modulus (stiffness) [12]. Additional quantitative pixel intensity versus depth data derived from OCT images reported in this study can be used to further quantitatively characterize skin lesions. The results of this study indicate that a color-coded image and a rapid scan of the image can be used to differentiate between normal skin and SK and cancerous lesions including BCC, SCC, and melanoma with a high sensitivity and specificity. Quantitative OCT measurements along with dermoscopy and visual inspection could be used together to screen for cancerous lesions while decreasing the biopsies done on benign skin lesions. Use of green and blue OCT images of a lesion provide visual images that along with dermoscopy images provide rapid information about the cellular and collagen contents of a lesion.
In addition, VOCT study results reported for AKs, BCCs, SCCs, and MELs demonstrate that new resonant frequency peaks are evident compared to those seen in normal skin [12]. These peaks have different stiffnesses from those found for components of normal skin and were used to quantitatively analyze differences among skin lesions [12]. The increased resonant frequency of cancer associated fibroblasts and fibrotic tissues explain the increased stiffnesses (moduli) of cancerous lesions [12].
In this paper we present results breaking down OCT images of normal skin, BCCs, SCCs, seborrheic keratoses, and melanomas into low (green), medium (Blue), and high (red) pixel intensity channels. The pixel intensity data and images along with machine learning analyses were used to differentiate between normal skin and different skin lesions. While the color-coded OCT images of these lesions are qualitatively different (see Figure 1), the details of the differences can be better understood by analyzing the low (Figure 2) and medium (Figure 3) pixel intensity images. Skin cancers including BCC, SCC, and melanoma have very weak green channel images (see Figure 2) due to the formation of either cell clusters (BCC and SCC) or large melanin particles as discussed previously [38-41]. In comparison, normal skin and SK, a benign lesion, have well defined green channel OCT images since they lack large scattering elements present in BCCs, SCCs, and melanomas. These scattering elements include melanin aggregates, cellular clusters, and fibrotic collagen [38- 42]. The lack of pixel intensity in the green channel of BCC, SCC, and melanoma reflects the presence of cellular clusters (BCC and SCC) and melanin particles (melanoma).
In comparison to the green channel, the blue channel is evident throughout the epidermis and papillary dermis for skin cancers including BCC, SCC, melanoma (Figure 3) while normal skin and SK show a hyporeflective region just below the stratum corneum. This hyporeflective region in normal skin and SK probably represents the dermal collagen in the papillary dermis where the collagen fibers are small enough to undergo Rayleigh scattering in all directions leading to the hyporeflective regions. In contrast in skin cancers hyperreflective fibrotic material probably reflects large diameter collagen fibers oriented around the lesions. In the normal reticular dermis large collagen fibers forward scatter light (Mie Scattering) resulting in a hyperreflective appearance below the papillary dermis. In contrast small collagen fibers in the papillary dermis scatter light at all angles (Rayleigh scattering) resulting in a hyporeflective space below the epidermis [12]. It is likely that the hyperreflective blue channel image reflects the formation of large diameter collagen fibers, i.e. fibrosis, seen surrounding cancerous clusters of basal cells.
By viewing the green and blue channel images as well as looking at the pixel intensity versus depth plots the differences between benign and cancerous lesions can be evaluated noninvasively. The low, medium, and high pixel intensity images give us qualitative information about the differences between benign and cancerous lesions. These images can be scanned parallel to their surfaces to give quantitative pixel intensity versus depth profiles as are shown in Figures 5-8. The difference in the shapes of these profiles based on the maximum pixel intensity and the width at the half height serve as parameters that along with machine learning that can be used to differentiate BCC lesions from normal skin, SCCs, SKs, and melanomas with a sensitivities and specificities between about 80 and 100%. These data in conjunction with visual inspection and dermoscopy provide a noninvasive means to differentiate between cancerous and benign skin lesions especially for lesions that are difficult to diagnose without histopathology.
The ability to provide screening quantitative data using OCT images and pixel intensity versus depth plots adds additional information to what is obtained from visual inspection and dermoscopy to noninvasively screen skin lesions. The ability to collect OCT information over the internet and monitor it remotely will be useful in promoting teledermatology.
Conclusions
We have used color-coded OCT images of normal skin, seborrheic keratoses and cancerous skin lesions to differentiate between benign and cancerous lesions. Our results suggest that green (low intensity) and blue (medium intensity) channel OCT images provide noninvasive information on cellular and melanin aggregates (green channel) and large diameter collagen fibers (blue channel) that can be used to differentiate between cancerous and benign skin lesions. Machine learning study results suggest that the maximum pixel intensity and the half-height pixel width measurements can be used to differentiate basal cell carcinoma from other skin samples with a sensitivity and specificity between 80% and 100%. These results suggest that noninvasive OCT measurements in conjunction with visual inspection and dermoscopy can be used to screen patients for cancerous lesions remotely, potentially minimizing the number of excisions done and improving patient satisfaction with skin screenings.
References
1. Kim DP, Kus KJB., Ruiz E. Basal Cell Carcinoma Review. Hematology Oncol Clin North Am. 2019 33(1):13–24 (2019).
2. Hernandez LE, Mohsin N, Levin N, Dreyfuss I, Frech F, et al. Basal cell carcinoma: An updated review of pathogenesis and treatment options. Dermatol Ther. 2022 35(6), Jun 12.
3. Fagan J, Brooks J, Ramsey ML. Basal Cell Cancer. 2023 Apr 14.
4. McDaniel B, Badri T, Steele RB. Basal Cell Carcinoma. 2024 Mar 13.
5. The American Cancer Society. What Are Basal and Squamous Cell Skin Cancers? 2023; Dec11.
6. Reiter O, Mimouni I, Dusza S, Halpern AC, Leshem YA, Marghoob AA, et al. Dermoscopic features of basal cell carcinoma and its subtypes: A systematic review. J Am Acad Dermatol.2021; 85(3):653–64.
7. Yélamos O, Braun RP, Liopyris K, Wolner ZJ, Kerl K, Gerami P, et al. Dermoscopy and dermatopathology correlates of cutaneous neoplasms. J Am Acad Dermatol.2019; 80(2):341–63.
8. Wozniak-Rito A, Zalaudek I, Rudnicka L. Dermoscopy of basal cell carcinoma. Clin Exp Dermatol. 2018; 43(3):241–7.
9. Popadić M. Statistical evaluation of dermoscopic features in basal cell carcinomas. Dermatologic Surgery. 2014; 40(7):718–24.
10. Dourmishev L, Rusinova D, Botev I. Clinical variants, stages, and management of basal cell carcinoma. Indian Dermatol Online J. 2013; 4(1):12.
11. Weber P, Tschandl P, Sinz C, Kittler H. Dermatoscopy of Neoplastic Skin Lesions: Recent Advances, Updates, and Revisions. Curr Treat Options Oncol.2018;19(11):56.
12. Silver FH, Desmukh T, Ryan N, Room A, Nadminti, H. Non-invasive characterization of different types of basal cell carcinomas (BCCs) using vibrational optical coherence tomography (VOCT): Can early lesions as small as 0.05 mm be identified by VOCT? Medical Research Archives 10(2).
13. Puig S, Cecilia N, Malvehy J. Dermoscopic criteria and basal cell carcinoma. G Ital Dermatol Venereol. 2012; 147(2):135-40.
14. Camela E, Ilut Anca P, Lallas K, Papageorgiou C, Manoli SM, Gkentsidi T, et al. Dermoscopic Clues of Histopathologically Aggressive Basal Cell Carcinoma Subtypes. Medicina (B Aires).2023; 59(2):349.
15. Gürsel Ürün Y, Fiçicioğlu S, Ürün M, Can N. Clinical, Dermoscopic and Histopathological Evaluation of Basal Cell Carcinoma. Dermatol Pract Concept.2023; 13(1): e2023004.
16. Behera B, Kumari, R, Thappa, DM, Gochhait, D, Srinivas, BH, Ayyanar P, et al. Dermoscopic features of basal cell carcinoma in skin of color: A retrospective cross-sectional study from Puducherry, South India. Indian J Dermatol Venereol Leprol.2021;89:254.
17. Wang W, Chen Y, Wang C, Wang J, Chang C. Dermoscopic features of pigmented basal cell carcinoma according to size. Int J Dermatol.2024; 63(7):916–21.
18. Krzysztofiak T, Suchorzepka M, Tukiendorf, A, Wojcieszek P, Kamińska-Winciorek G. Basal Cell Carcinoma After High Dose Rate Brachytherapy: Medium-term Dermoscopic Evaluation of Cancer’s Response. Dermatol Ther (Heidelb).2023; 13(9):2063–78.
19. Song Z, Wang Y, Meng R. Chen Z, Gao Y, An X, et al. Clinical and dermoscopic variation of basal cell carcinoma according to age of onset and anatomic location: a multicenter, retrospective study. Arch Dermatol Res.2023; 315(6):1655–64.
20. Suppa M, Micantonio T, Di Stefani A, Soyer HP, Chimenti S, Fargnoli MC, et al. Dermoscopic variability of basal cell carcinoma according to clinical type and anatomic location. Journal of the European Academy of Dermatology and Venereology.2015; 29(9):1732–41.
21. Coppola R, Barone M, Zanframundo S, Devirgiliis V, Roberti V, Perrella E, et al. Basal cell carcinoma thickness evaluated by high-frequency ultrasounds and correlation with dermoscopic features. Ital J Dermatol Venerol.2021; 156(5):610-615.
22. Lombardi M, Pampena R, Borsari S, Bombonato C, Benati E, Pellacani G, et al. Dermoscopic Features of Basal Cell Carcinoma on the Lower Limbs: A Chameleon! Dermatology.2017; 233(6):482–8.
23. Lupu M, Caruntu C, Popa MI, Voiculescu, VM, Zurac S, Boda D, et al. Vascular patterns in basal cell carcinoma: Dermoscopic, confocal and histopathological perspectives. Oncol Lett.2019; 17(5):4112-4125.
24. Popadić M, Vukićević J. What is the impact of tumour size on dermoscopic diagnosis of BCC? Journal of the European Academy of Dermatology and Venereology.2015; (12):2474–8.
25. Sanchez-Martin J, Vazquez-Lopez F, Perez-Oliva N, Argenziano G. Dermoscopy of Small Basal Cell Carcinoma: Study of 100 Lesions 5 mm or Less in Diameter. Dermatologic Surgery.2012;38(6):947–50.
26. Xu LJ, Zheng LL, Zhu W. Effect of tumor size on dermoscopic features of pigmented basal cell carcinoma. Chin Med J (Engl).2021; 134(15):1866–8.
27. Takahashi A, Hara H, Aikawa M, Ochiai T. Dermoscopic features of small size pigmented basal cell carcinomas. J Dermatol.2016; 43(5):543–6.
28. Foltz E, Ludzik J, Witkowski A. Dermoscopy and reflectance confocal microscopy‐augmented characterization of pigmented micro‐basal cell carcinoma (less than 2 mm diameter). Skin Research and Technology.2023; 29(1):e13250.
29. Sykes AJ, Wlodek C, Trickey A, Clayton GL, Oakley A. Growth rate of clinically diagnosed superficial basal cell carcinoma and changes in dermoscopic features over time. Australasian Journal of Dermatology. 2020; 61(4):330–6.
30. Pampena R, Parisi G, Benati M, Borsari S, Lai M, Paolino G, et al. Clinical and Dermoscopic Factors for the Identification of Aggressive Histologic Subtypes of Basal Cell Carcinoma. Front Oncol 2021;10:630458.
31. Park. Eskin-Layer Analysis Using Optical Coherence Tomography (OCT) Med Lasers 2014; 3(1):1-4.
32. Olsen J, Holmes J, Jemec GB. Advances in optical coherence tomography in dermatology-a review. J Biomed Opt. 2018; 23(4),1-10.
33. Zeppieri M, Marsili S, Enaholo ES, Shuaibu AO, Uwagboe N, Salati C, et al. Optical Coherence Tomography (OCT): A Brief Look at the Uses and Technological Evolution of Ophthalmology. Medicina 2023; 59:2114.
34. Wan B, Ganier C, Du-Harpur X, Harun N, Watt FM, Patalay R, et al. Applications and future directions for optical coherence tomography in dermatology. British Journal of Dermatology 2021; 184:1014–1022.
35. Mogensen M, Thrane L, Jørgensen TM, Andersen PE, Jemec GB. OCT imaging of skin cancer and other dermatological diseases. J Bio photonics .2009; (6-7):442-51.
36. Olsen J, Holmes J, Jemec GB. Advances in optical coherence tomography in dermatology-a review. J Biomed Opt. 2018; 23(4):1-10.
37. Babalola O, Mamalis A, Lev-Tov H, Jagdeo J. Optical coherence tomography of collagen in normal skin and skin fibrosis. Arch Dermatol Res.2014; 306(1):1-9.
38. Silver FH, Kelkar N. The Vibrational OptoScope: A New Device to Evaluate Efficacy of Esthetic Treatments and Development of an Accelerated Skin Care Protocol. Clinical Research in Dermatology 2020; 3(1):1.
39. Sendín-Martín M, Posner J, Harris U, Moronta M, Conejo-Mir Sánchez J, Mukherjee S, et al. Quantitative collagen analysis using second harmonic generation images for the detection of basal cell carcinoma with ex vivo multiphoton microscopy. Exp Dermatol.2023; 32(4):392-402.
40. Skaggs R, Coldiron B. Skin biopsy and skin cancer treatment use in the Medicare population, 1993 to 2016. J Am Acad Dermatol.2021; 84(1):53-59.
41. Silver FH, Deshmukh T, Ritter K, Nadiminti H. Differences Between Edges and Centers of Melanomas Using Vibrational Optical Coherence Tomography: The Effects of Critical Lesion Size. SciBase Oncol.2024; 2(1):1011.
42. Silver FH, Deshmukh T, Nadiminti H, Wassef C, Pappert A, Lawal A, et al. Use of Optical Coherence Tomography images to Differentiate Between Normal Skin, Skin Lesions, and Melanoma: A Pilot Study. J Clin Med Img.2024; 8(6):1-11.
43. Gajinovi Z, Matic M, Prcic S, Duran V. Optical properties of the human skin review article serbian journal of dermatology and venereology.2010; 2(4):131-136.
Received: January 02, 2025;
Accepted: Janury 27, 2025;
Published: January 29, 2025.
To cite this article : Silver FH, Deshmukh T, Patel A, Dhillon J, Bobra A, Nadiminti H . Rapid Noninvasive Skin Screening for Basal Cell Carcinomas using Vibrational Optical Coherence Tomography. British Journal of Cancer Research. 2025; 8(1): 747- 755. doi: 10.31488/bjcr.202.
© The Author(s) 2025. This is an open access article distributed under the terms of the Creative Commons Attribution License (https://creativecommons.org/licenses/by/4.0/).